Oliver – Looking Outwards – Assignment 08A
Arduino and BlinkM Music Visualizer
by Jarv.org
http://jarv.org/2009/11/arduino-and-blinkm-music-visualizer/
[youtube http://www.youtube.com/watch?v=3ZnJK6yU8z4]
Last week I found myself at a local dive bar where the bartender had two dogs whom were allowed to run around and bark at the customers. Other than the barking and the clicking of the Wheel of Fortune coming from the TV in the corner, the bar was silent. With every dog bark, a string of lights hanging near the ceiling lit up temporarily with the shrill sound, and then became dark again. The lights were obviously meant to react to music and its beats, which is exactly the idea of this Arduino music visualizer. The creator (whose name is not included in the blog post) used BlinkM LED lights connected to an Arduino and a power amp to flash in response to music. The code is included in the blog post, but I don’t understand how the music is transmitted to the Arduino and how it is processed into light patterns. Is the power amp acting as a sensor and reading the music in some way, or is the Arduino itself able to hear the music? The effect is beautiful, and I could imagine it would be very impressive on a larger scale. As it is, the system fits in a small plastic box and could be easily brought to a party.
City Peaks
by Digit
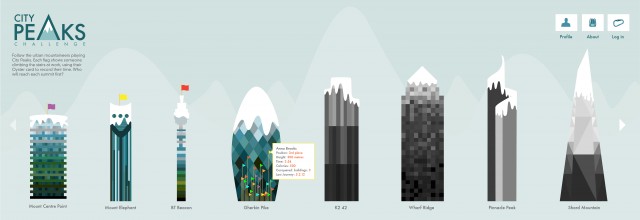
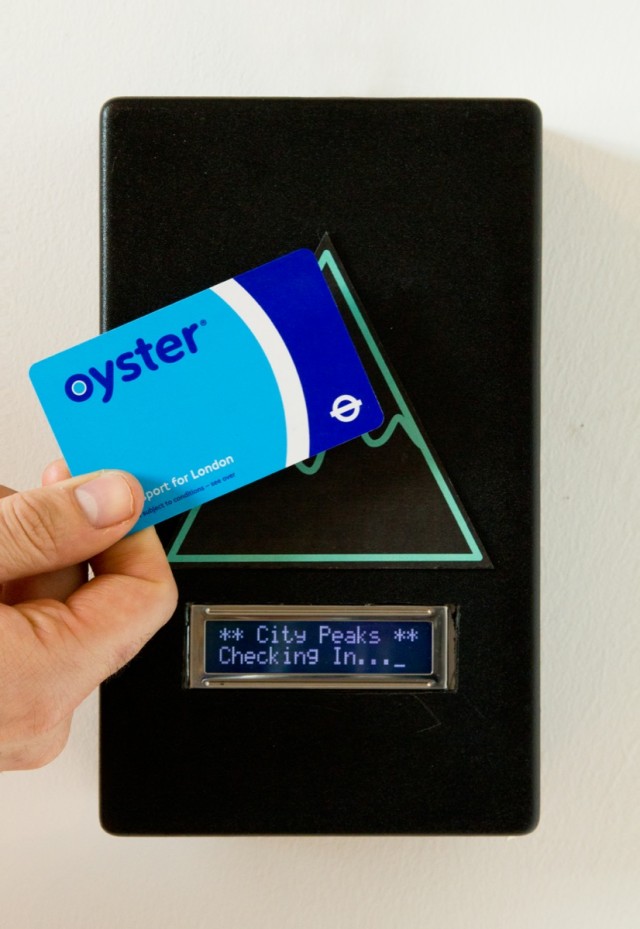
City Peaks is a project encouraging fitness among staff in an office building by tracking how many times each employee climbs the office stairs, then visualizing this data in a fun, competitive manner. Although the website doesn’t say exactly how Arduino is used in this project, I’m pretty sure that it is used to power the card swipe devices at the bottom and top of the stairs. I imagine that a sensor is attached to the Arduino which recognizes an employee’s card. The Arduino then keeps track of the staircase climbing data for each user. The card swipe device also includes a small screen that displays text, which is also powered by the Arduino. The visualization is then created using the data that the Arduino collects, and it shows a picture of a particular iconic tall building or mountain with flags denoting each user’s position on the mountain as an aggregate height of their office stair climbs. The project encourages competition, as each employee wants to be the first to reach the top of the mountain or building. This is an example of a way that Arduino can be used along with other tools as part of a larger project, in this case a project which helps to improve health and fitness among a community.
Visualizing Sensor Data with Arduino and Processing
by Cory Barton
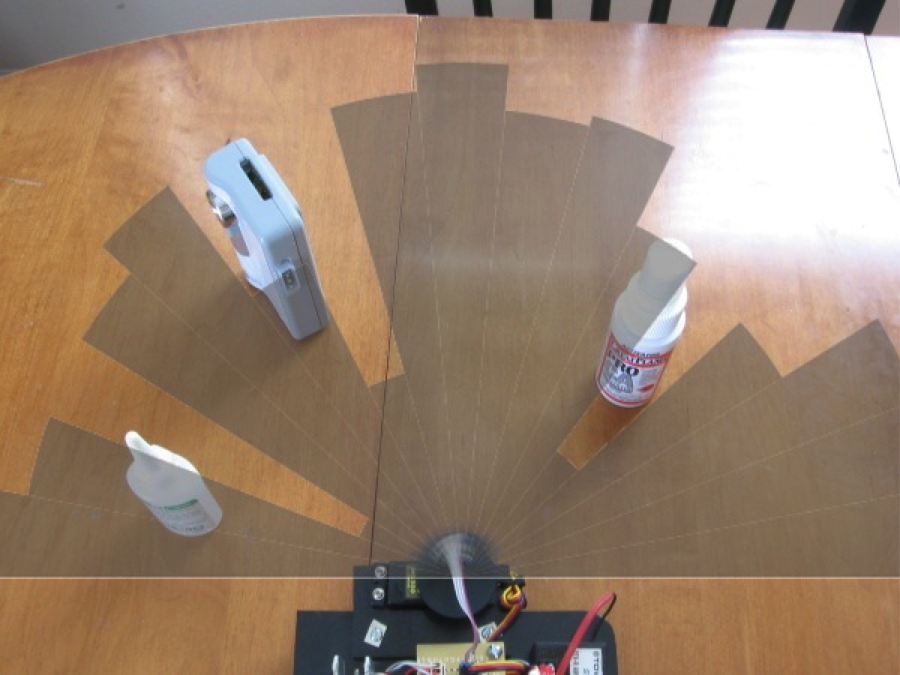
This is a cool project that combines Arduino, Processing, and data visualization. Cory Barton used Arduino and Processing to visualize the objects within 180 degrees in front of a robot, as a way of giving “vision” to the robot. The Arduino is using a proximity sensor to record the distance between the robot and an object in its field of vision, if there is an object present. Starting from one side, the sensor takes 17 steps to complete the 180 degrees, and in each step determines whether an object is present and where it is located. Then Processing is used to draw an arc, which ends at the point where the object stands. If there is no object in a particular direction, the arc extends the maximum amount. The visualization does not match up exactly with the photograph, due to some scaling issues. I like this project because it shows how physical computing can be used to collect data with sensors, and the data can then be visualized in such a way that we can understand intangible things like vision for a robot.