John Brieger — Looking Outwards 2 (Info Visualization)
Information visualization is a tricky art. I picked a few I liked and thought other people might like to see.
Snake Oil: Visualizing Health Supplement Data
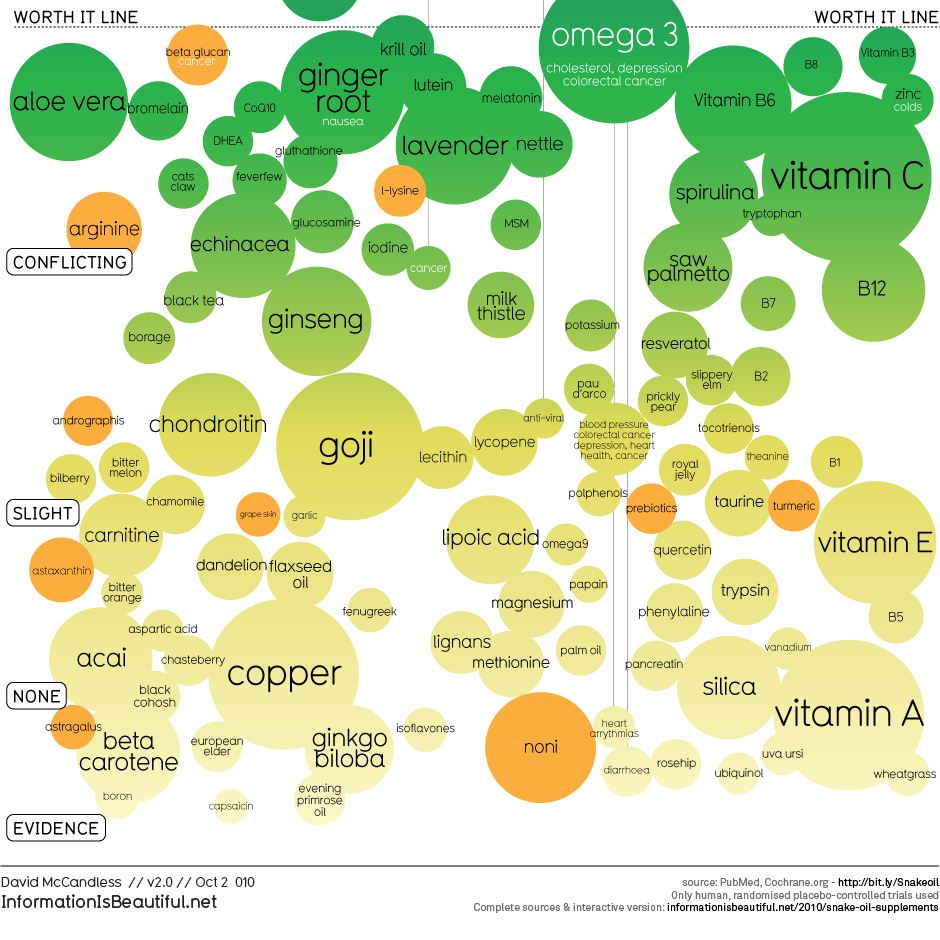
Click the picture to go through to the interactive visualization.
Cinemetrics
[vimeo=http://vimeo.com/26584083 w=600]
Similar to Wattenberg’s shape of song, Cinemetrics is a way to visualize the entirety of film at once. I liked the comparisons between multiple works by the same director in particular.
Comments Off on John Brieger — Looking Outwards 2 (Info Visualization)