Xing Xu-InfoVis
Data visualization of people dancing
When I started thinking about visualize data, I tried to use the data from a picture, text or numbers. But seldom, people realize it is interesting to visualize data of the movement of body. Kinect helps to collect the data of the joints. To make the project more fun, I got the idea of data visualization of people dancing. Thus the first step is to collect the data. I am really familiar with using Unity wrapper for Kinect. Thus I collect the data of 20 joint from the body including their position and speed. Later, I started to invite people to dance. I have no idea about how the visualization will look like and is there a big difference between people when they are dancing differently. And I used Processing the visualize the data by changing the intensity of color.
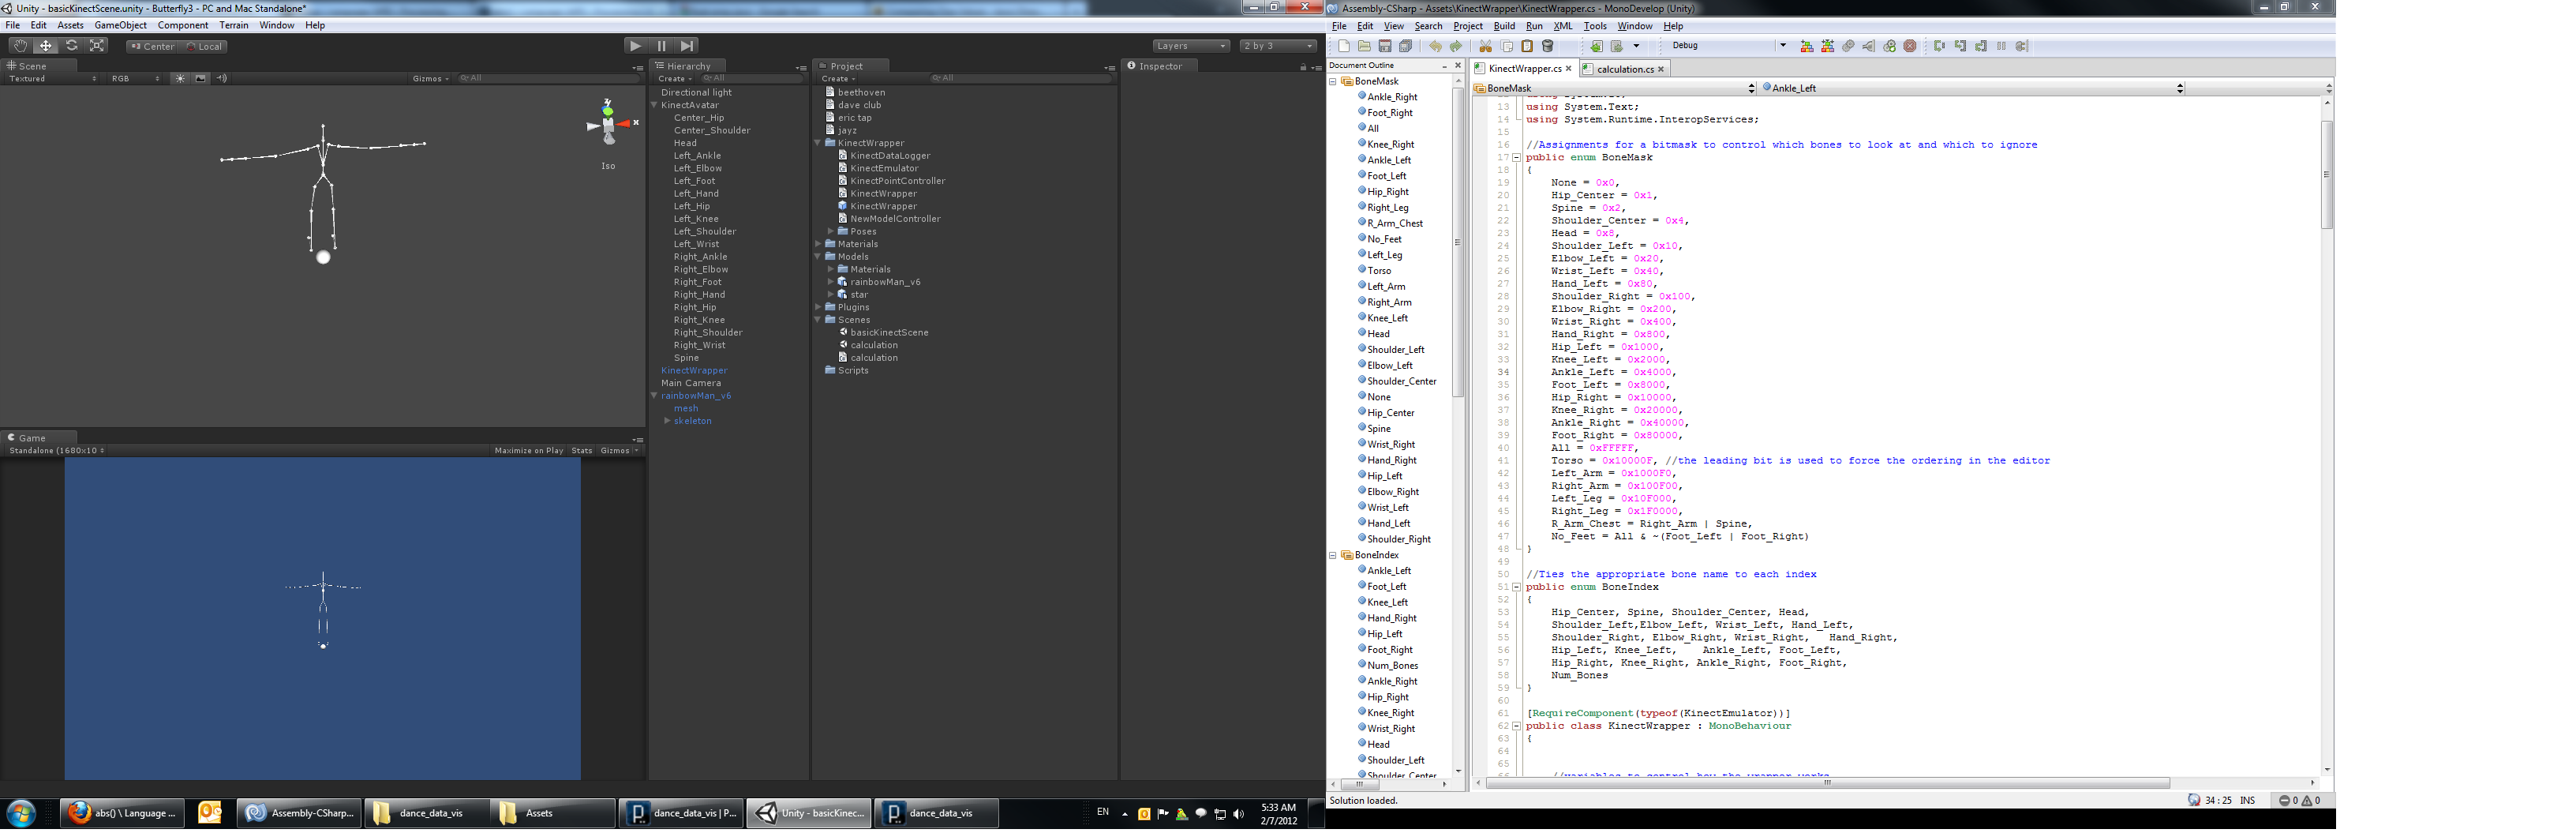
Here is some of the data I collect:(0.1, 1.1, 0.6, 0.0)(0.1, 1.2, 0.6, 0.0)(-0.1, 1.3, 0.6, 0.0)(-0.2, 1.4, 0.7, 0.0)(-0.1, 1.2, 0.6, 0.0)(-0.2, 1.3, 0.9, 0.0)(0.0, 1.3, 0.8, 0.0)(0.0, 1.3, 0.8, 0.0)(0.1, 1.5, 0.6, 0.0)(0.2, 1.4, 0.4, 0.0)(0.3, 1.2, 0.4, 0.0)(0.4, 1.2, 0.4, 0.0)(0.1, 1.0, 0.6, 0.0)(0.1, 0.7, 0.9, 0.0)(0.0, 0.4, 0.8, 0.0)(-0.1, 0.4, 0.8, 0.0)(0.2, 1.1, 0.5, 0.0)(0.2, 0.7, 0.4, 0.0)(0.0, 0.4, 0.5, 0.0)(0.0, 0.4, 0.5, 0.0)vel(0.0, -0.1, 0.0)(0.0, -0.3, 0.0)(0.5, -1.7, -0.2)(1.0, -1.3, -0.1)(0.5, -1.6, -0.1)(0.8, -1.3, -1.4)(3.1, -4.1, -2.4)(2.6, -5.2, -4.3)(-1.2, -0.1, 1.1)(-0.8, 0.3, 1.2)(0.0, 0.0, -0.1)(1.1, 0.2, -0.5)(0.3, -0.4, 0.2)(0.3, -0.7, -0.1)(-1.5, -0.4, -0.2)(-3.6, -0.5, -3.6)(-0.2, -0.1, -0.3)(0.0, -0.1, -0.1)(0.0, -0.1, 0.0)(-0.1, 0.0, 0.0)pos
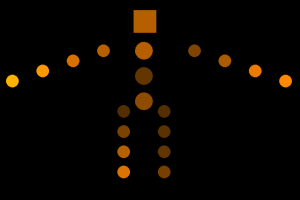
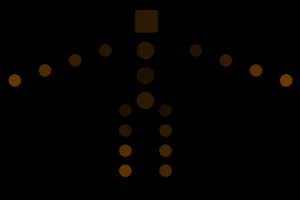
Dave’s dancing visualization Eric’s dancing visualization
It is interesting to see the difference between these two picture. Because the dancing styles are very different, Dave dances like in a club and Eric dances tap dance. The common thing is that the legs and arms are the strongest moving joints of the body. But tap dance is more tender and the major body does not bear too much movement.
Presentation slides:
https://docs.google.com/present/edit?id=0ATFNJZOdZrYuZGd3ZjVmcl81Zjh4ZmtxY3g&hl=en_US
========================================
Xing XU: Data visualization of people dancing
Check out Norman McLaren’s “Pas De Deux”: http://www.youtube.com/watch?v=4h1ipObKYB4
Try deploying this with trained dancers
You could probably use a larger dataset (more dancers) also, a comparison of more styles
+1 +1
What conclusions would you draw so far? how do you find it interesting?
yes, normalization would be useful here
This is definitely an interesting approach to dance visualization, it’s not what I would expect. I’m not sure it’s the most meaningful or beautiful angle to approach this though. You might be able to derive the same insight (about joint motion) from some kind of spatialized representation. Would have looked cooler.
It’s unclear if the average movement of the dance is this straight-arms-outstretched stance, or just joint movement data. Do you just have two styles of dance? What about trying to find differences in style from person to person within one genre of dance, like irish or tap or …. What about getting large movement in ballroom dance, like using the kinect to get the overall body position and the shapes the dancers make
You’ve visualized and calculated the amount of motion per joint. But this doesn’t really characterize a dance — it’s directions of movement (side-to-side, up-and-down) and its periodicities (loops in movement). There are ways of visualizing this: using chroma for direction, for example.
You need to learn about NORMALIZATION — normalizing for the overall motion. Otherwise, your visualization confuses the difference between visualizing the dancers versus visualizing the dances. For example, if two different people are doing similar dances, the results should look the same. It shouldn’t matter if one person was dancing for a longer amount of time, or if one person was making
Would have been interesting to use some kind of machine learning or pattern recognition to ‘understand’ people’s dances? How do you characterize dances?
This is an interesting idea. It’s a little unclear how you are visualizing the dance movements. I think a larger dataset, maybe including people doing different styles of dances, would make this a more informative visualization.
I like the idea of visualizing human skeletons/joints but the visualization is quite unclear. Like many people mention here, it is better to collect more data if you want to average out patterns of people’s different movements.
Would be nice to see a considerably larger number of people especially with small groups dancing a similar dance.
I like the simplification of the body structure into a bunch of circles, stylistically it made for an interesting visual. i don’t really understand what exactly you’re looking at. the image on the right is kind of hard to see (not sure if it’s the projector) ….i just don’t think i understand what you’ve learned from this.
I was confused about what exactly was being visualized, but now I understand. What if the data was mapped to another aspect? What if it was akin to a colorful whirlwind of the joints? Definitely an interesting exploration to see what joints were the most active. Very interesting beginning
Nice dance intro. funny.
Can I use this prove to my friend’s that I am in fact a fantastic dancer? I have a score to settle.
I’m not sure if there’s any need to show the code and raw data points in the presentation.
It’s unfortunate that you were only able to collect information from two people, so I’d be interested to see what happens with more dancers. I’m also unsure about the comparison between the two dance styles; it seems unfair. Are you trying to find the difference between dance styles or between individual dancers?h
Are all the dances on the same song or different songs? This is interesting in the sense that it can be investigated in many different ways: for each person (their styles), across genres or across specific songs. I also think the visualization could be interesting if you could superimpose different styles over each other so that perhaps common patterns emerge as opposed to comparing each image to another. I think the topic is pretty cool.
Something relevant to your interests maybe: http://www.cs.colorado.edu/~lizb/chaotic-dance.html That’s a project I worked on in my undergrad using motion capture data and chaotic systems to generate new dance sequences. We had to use fancy expensive motion capture cameras (I think they belonged to CMU) to capture the data, but these days with the Kinect it would be super easy. The hardest part was interpolating between body positions without breaking someone’s arm or leg.
It seems you took an approach to skeletal data that doesn’t not really make sense or is the logical. There might be room for discovery by visualizing in such way that most kinect data is analyzed.
It seems like you have a good grasping of how the data works. how could you present it to us so that we understand that those two images were different styles of dancing and that they show up different in location & brightness.
I wonder if you could show little animations of different styles of dancing (tap, hip hop, freestyle etc) and let people explore how the basic visualizations is showing this
could you let people make recordings and classify their dance style- then explore an average of all of the dancing of different styles
I find it really interesting that you thought of visualizing the amount of movement per joint. I have never thought of perceiving dance this way. It is really awesome that you can actually get an idea of the person’s personality by this type of data.
Question… oh wait, I see, so it’s a kind of heat map according to how much the joint moves? so Eric’s visualization is so dark because he mostly dances with his hands?
It would probably be fun to look at different dance styles: ballet, breaking, hip hop, &c. Other types of movement might be interesting, too. I’m thinking of practitioners of different style of martial arts: capoeira, tai chi, tae kwon do, &c.
Why was Unity used to analyze the data? There is much easier libraries for grabbing joints. Unity is exciting software, but it seems under utilized in this situation.
I appreciate you showing the process, but we don’t have to see everything.. like all the numbers on the slide.
** I actually think it is interesting to see the raw data. It’s fun to see what you are working with at the most basic level.
I would like to see this data contrasted in some way with people’s perceptions of what is good dancing. Do people who dance well not move some certain part of their body? Do they move some part of their body more?
** interesting idea !
so, are you saying that the shapes are brighter if they moved more? would be nice to state that.
It would be cool have data from a professional dancer as well for comparison
It could be interesting to get data from different genres of dance and compare them to see if there’s any overlap in movements?
Part of the interest of dance is the motion, many the final product of data could be an animation rather than a still image?
I like Golan’s ida about mapping to a range
could potentially change your typography or add some color to your presentation.
How about comparing males to females dancing?
**Yeah. That would be interesting.
I liked the fact you used kinect to collect your data – it always surprises me how much information you can collect using kinect from different scenarios / use cases.
** yea it kinda reminds me of the captions that come up on the photos after you play a kinect game and how that info is parsed
Especially since you already have the 3D kinect data, Optiocal flow might be an interesting way to go as so far as generating visuals.