SankalpBhatnagar-FinalProject-Ideas
So I’m an instructor for Carnegie Mellon’s famed student taught course, Sneakerology, the nation’s first college accredited course devoted to sneaker culture. Every year we have a final event, called KICKSBURGH, which is a celebration of sneakers! One of our course’s first KICKSBURGHs in 2008 hosted a really awesome interaction project called the Sneaker Mirror by Jesse Chorng (UPDATE: Apparently Jesse was a student of Golan’s. Wow! what a small world) that displayed a projected image captured from a foot-level camera, but instead of pixels, it was use a catalog of famous sneakers from throughout history! This is what inspires me to make an interactive data visualization. I’m not quite sure how I’d do it it, but I’ll ask people’s thoughts in class.
—
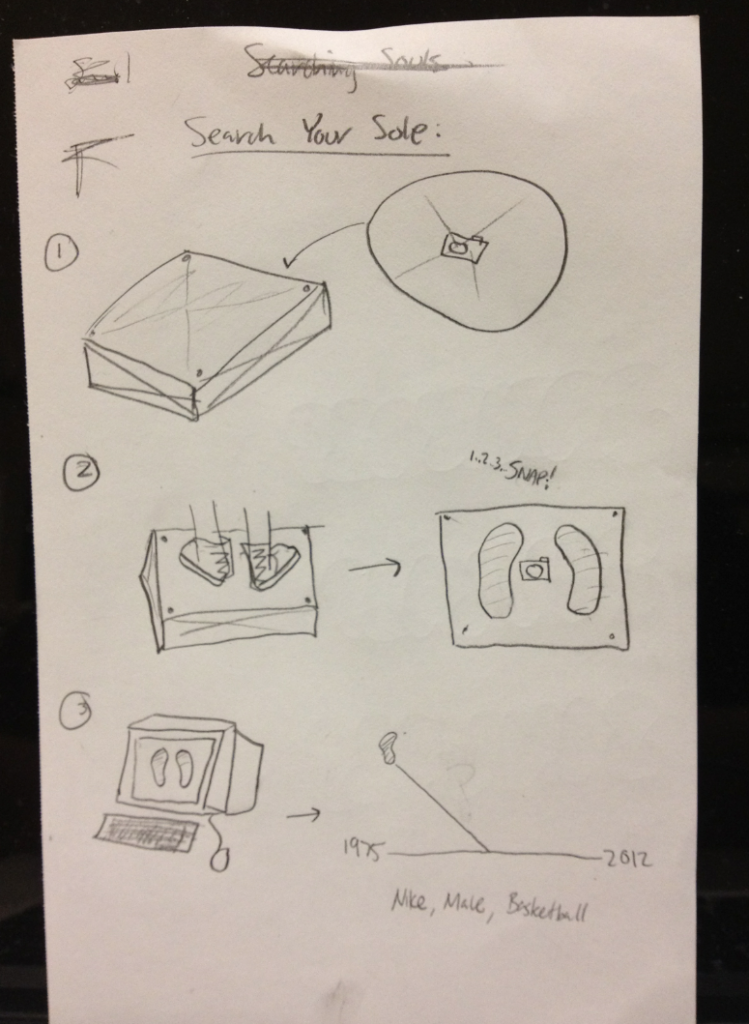
Okay, so I got back from class earlier this week and I met with a few of the stellar people in my segmented group and I brought up the visualization of sneakers idea, and people really liked it. They recommended I do something with chronology of sneakers, and I agree, because I like showing how time effects objects, etc. Then Golan recommended I do something involving the sole of sneakers (see sketch below) which I think would be cool, but I’m not quite confident about in terms of actually building it, I mean I don’t exactly have the skills to do something based in industrial design, but we’ll see…
—
So I’m starting to think this whole sneaker visualization thing might not be the best thing for me. Right now, I have a lot on my plate, what with actually planning this year’s Kicksburgh event and I’m not sure I can round up everything I need, including the knowledge of how to build something like this, by the proposed deadlines. I like the idea of getting a user to stand on a device, but I’m not quite sure focusing on soles would be a good idea since there are a lot of little things that could get in the way (how to implement it? how exact it can be? do I make it voluntary or involuntary?). I’m hoping to involve a user, or at the very least, myself in a voluntary interactive data visualization..
—