Category Archives: project-2

Alan

06 Feb 2013

I archived all kinds of online knowledge in this website https://pinboard.in. There are also a big database for public knowledge to share.

Here’s the api to get all these information. https://pinboard.in/api/

I am trying to visualize how I am currently managing my online knowledge and what’s the relations between different topics and different people.

Erica

06 Feb 2013

I have a few ideas for the types of data I’d like to work with for my Info Vis project but I’m not sure which would be the most interesting, have relatively accessible information, and/or lend itself to an interesting visualization. A lot of my ideas pertain to Judaism, which has a lot of somewhat complicated laws that might be easier to learn/understand if they could be visualized:
1. Information pertaining to Koshrut (i.e. whether Jews are allowed to eat certain types of food). The types of information I could obtain about Koshrut is pretty diverse; I could gather information about the specific laws and whether these came from the Torah or the Misnah (basically if it is the 5 books of Moses or is from the Rabbis), as well as a more practical focus on what products you can actually buy in a super market, what companies they come from, what level of Koshrut they pertain to, etc.
2. Laws and Customs specifically pertaining to Shabbat (the day of rest from Friday evening to Saturday evening). There are a lot of dos and don’ts when observing Shabbat, as well as different customs that are followed by different types of Jews. Usually these customs are dependent on what part of the world a specific family is from.
3. Prayers – when, where, with who, for what purpose is each prayer supposed to be said – pretty self-explanatory
I am also really interested in the diversity of Jews both in terms of location and in terms of level of practice. Given this,
4. Assimilation of Jews in different countries, or maybe specifically the US – how, when, why Jews began to assimilate, what traditions they continue to follow and which were deemed to extraneous to keep up with, where most assimilation occurred, etc.
5. Different Customs – different Jews around the world have varying customs for different aspects of Judaism, which types of Jews follow what customs, where and why these customs originated, etc.
I have a few other ideas that have nothing to do with Judaism but are just various things that I like/am interested in:
6. Pronunciations of English words and where they are used – different parts of the country pronounce certain words differently and it would be interested to be able to explore this using data vis and possibly audio as well
7. Price is Right Data – I don’t know about the rest of you but I have been watching this show ever since I was little and by now know every game pretty much by heart but I’ve kind of always wondered if you are actually on the show what is the best game to play in terms of having the best chance of winning. I think it would be interested to explore the payoffs of different games using probability models.
8. My iTunes Data – I’ve noticed that my taste in music has changed a lot over the past few years and my iTunes pretty much has a record of this through the play count and the last played data it tracks. It would be interested to see the progress in my own personal music taste by visualizing this (and maybe other) data.
9. Twilight Zone – I love this show and I don’t know specifically what data I would want to scrape regarding this show but there are definitely a lot of different kinds of data that I could scrape so I think there are possibilities.
10. Roller Coaster Data – Ever since I was about 8 I’ve been kind of a roller coaster junkie and I personally rate every one I right even internally or through description to friends or family. It would be cool to extract data about different types of roller coasters to get more of an objective comparison to go along side my subjective one.
11. Harry Potter – I through this one in here just for the hell of it. There are definitely lots of things that could be tracked about the books but I think it would be cool to do some sort of timeline and/or relationship graph of the entire series.
I know this is a lot, sorry for causing anyone who read this post to read so much!

John

06 Feb 2013

I spent a long time considering what to visualize and how to get the data make something compelling. I’m very anti scrape-and-see w/r/t these sorts of projects because (a) I’ve done that before and (b) I think scraping big text files for key terms is misleading and generally not as interesting as a lot of people seem to think.

So while I was ideating (as we designers do) I remembered a funny thing that happened this summer. I was at a hippy parade thing in Seattle (as you do) and I overheard a five-year-old kid ask his father “what’s the worst thing that’s ever happened to you?” which was the funniest and most amazing question for a little kid to ask anyone.

Anyway, that got me thinking. What would it look like to visualize answers to that? How would I aggregate those answers in a meaningful/compelling way? I’m not sure yet, but I’d like to find out.

That’s the first idea.

The other two stem from a similar germ of asking people to make spontaneous decisions and then using those decisions to model something (what, exactly that is, I’m not yet sure).

Idea number two is this: ask people how uncomfortable a series of words makes them and rank them.

Idea three is a universal bracket (a la the NCAA tournament) where we start with 32 sets of binary pairs which are then filtered to 32 winners. Each winner is then randomly paired with another winner then paired down and so on…I’m pretty sure this process might scientifically determine the best thing ever.

Here’s a photo of my sketchbook (where the magic happened):

IMG_0156

Joshua

06 Feb 2013

rhino_Truss_Sketch

A sketch I did of the truss in Rhino. The truss must reach the cylindrical pole to lift a load, and only touch the playing field at the opposite end. The colored lines are the springs of the truss. Using Grasshopper I simulated the springs and color coded each line according to whether it was in tension(reds and purples) or compression (greens) or unstressed (light blue).

The idea is to find the best (optimal) truss given a bunch of constraints and a specific loading.  The truss is a mesh where each node is a connection between struts, and each edge is a strut, which is approximated as an ideal elastic spring. This is actually an assignment for a mechE class called Stress Analysis, but the nature of the project makes it perfect for creating a genetic algorithm for optimizing the truss.

The basic structure would be:

1)mate parent trusses two create a bunch of offspring.

2)Introduce mutations.

3)Test all offspring for fitness.

4)Select fittest offspring.

5)Repeat until solution appears to be converging (not changing very much compared to the previous solution).

The main goal would be to  minimize deflection and weight of the truss.

In general optimization problems have a ‘cost function’ or a function that evaluates how good or bad a certain combination of variables is.  For example a chair could have a few parameters like height, weight, softness, and some complex mathematical expression might describe how these parameters combine to make a comfortable or not-so-comfortable chair.  In the case of a truss, where any number of connections are possible and the variables involve a large number of vertices and edges, determining such a cost function would be incredibly difficult.   Instead my plan is to simulate the behavior of the truss with springs under an idealized load.  The performance of the truss (like deflection, or maximum stress) would be quantified and used directly as the fitness of that truss. Thus the cost function would instead be a physical simulation.  Run times may be an issue.

I was trying to do this in processing but realized that it really is not made for computing precise values.  So I will do this in Matlab.

Caroline

06 Feb 2013


For my Generative assignment I want to create a version of the audio timeline that allows for input. So instead of composing for a track that will be the same each time it is played back, this program will allow the user to create a sound scape that will be different every time audio is plugged into some live data. Each blob on the right is linked to a track in ableton live, so the sound can be any mixture of synthesized and granular sound.

controlRedesignSmall4

Anna

05 Feb 2013

In my last post, I was mixing and matching generativity and infoVis, and this post is really no different — hopefully between the two, I’ll have delivered a complete blogpost on both topics.

Heartbeats — realistically.

A powerful and biologically accurate simulation of the beating human heart, with applications in medicine, pharmacology, and general awesomeness. This is great data viz on a number of levels, from the code to the graphics to the articulate video describing the purpose of the simulation. What I particularly love about this model is that despite the complexity of the mathematics and biological phenomena involved on the back end — and without abandoning that complexity — the researchers have created a simulation that is so aesthetically pleasing, in a way mirrors the deceptively simple elegance of the human body itself. How many people actually realize that heartbeats are this nuanced?

Daily dose of words: Shakespear(e) & Silenc(e).
henryV
Understanding Shakespeare

I’m a little bit bitter about anything in InfoVis that tackles Shakespeare, mostly because I’ve done a bunch of meddling with it myself, and then saw a kickstarter campaign with thousands of dollars of funding for essentially the same thing I’d abandoned. In //any// case, I really enjoyed these windows into William’s classic texts. They manage to convey a lot of data while still looking typographically appealing, which is something that a lot of word/language-based pieces seem to neglect. I feel an interesting tension when I look at these pieces. On one hand, they’re great (as the creator realized) as large posters; the immense amount of text contributes to visual interest. On the other hand, I wonder if I could learn something a little more meaningful if I weren’t shown //everything//. Making these interactive with more filtering options would enhance them a lot. My biggest lament? : Where is The Tempest?!


Silenc

Another project with text that is easy on the eye, and curious in concept. I’ve always wondered how the number of silent letters varies from language to language. When learning foreign languages, one feels surprisingly aware of all the ‘stuff’ one is skipping over in pronunciation: french seems to swallow everything, whereas german seems like all sharp stops and well defined vowels. Yet it’s difficult to ascertain whether this is reality or just perception. In my opinion, the most successful iteration of this project is the version where the ‘silent’ letters are moved to the bottom of the page, so one can easily visually compare quantities. One qualm: very few of the silent letters are truly ‘silent’; removing them — even from the title word ‘silenc(e)’ — has a drastic effect on how the word is said. So I guess my question is: what are we really trying to filter for here?

Soccer Stats. Because soccer is awesome, but the data viz is so poor…?

As somebody who tries very hard to coerce all my friends into playing fantasy champions’ league soccer while everybody else in the country plays fantasy NFL, and who therefore is always trying to answer questions like ‘who should I field this week?’ … ‘what’s a holding midfielder?’ … ‘offside?’… and ‘what country is [X] club from?’ I feel like I’m hyper aware of how hard it is to find good visualizations of soccer statistics, rules, and history. Below are two sort-of-nice but sort-of-anemic attempts at saying something about the world’s golden sport. The first actually tackles FIFA’s development work, which has the potential to be a fascinating socio-political resource as well as a sports’ resource, but the content is disappointingly shallow. The second is the interactive map from last year’s Eurocup, which I found charming, if simplistic. It’s also incorrect: Germany should’ve been the last team standing. [cough… hack… cough]


fifa

A map of FIFA development projects

euro2012
A Roadmap of Eurocup 2012

Dev

05 Feb 2013

Originally I wanted to do something generative, but then I came across a question I wanted answered, so I decided to do that instead.

Progrmming Style is a somewhat loose term. Having good style helps your code look nice and clean, but honestly good style it subjective. There are many guidelines, and there are many languages. I am curious to find patterns in style across languages and over the course of time.

I plan on using GitHubs API (http://developer.github.com/v3/) to data on popular repositories. I mainly want to grab the individual commits for a specific file in the repos (which can be specified by the user of the Infovis).

I then plan on abstracting the code into a bunch of colored rectangles based on syntax highlighting. The infovis shouldn’t care about the words in the code. Only spatial location of content is important. So imagine converting the code below into a bunch of colored rectangles.

Screen Shot 2013-02-05 at 11.18.56 PM


Once I can map code to rectangles, I can show its change in a very abstract way. A new commit can be presented by animating some rectangles. I can emphasize or demphasize the location of comments and definitions. I can even show the negative space to the left side, showing the indentation scheme that was used.

I’m curious to see the evolution of style on different GitHub communities, communities which differ in language used, people, and application. We’ll see how this turns out!

Update:

Here is a very basic visual of mapping keywords to rectangles of a C file on my computer. Darker rectangles represent comments. Hopefully this can help clarify what I mean by blockifying code.

code in blocks

Anna

29 Jan 2013

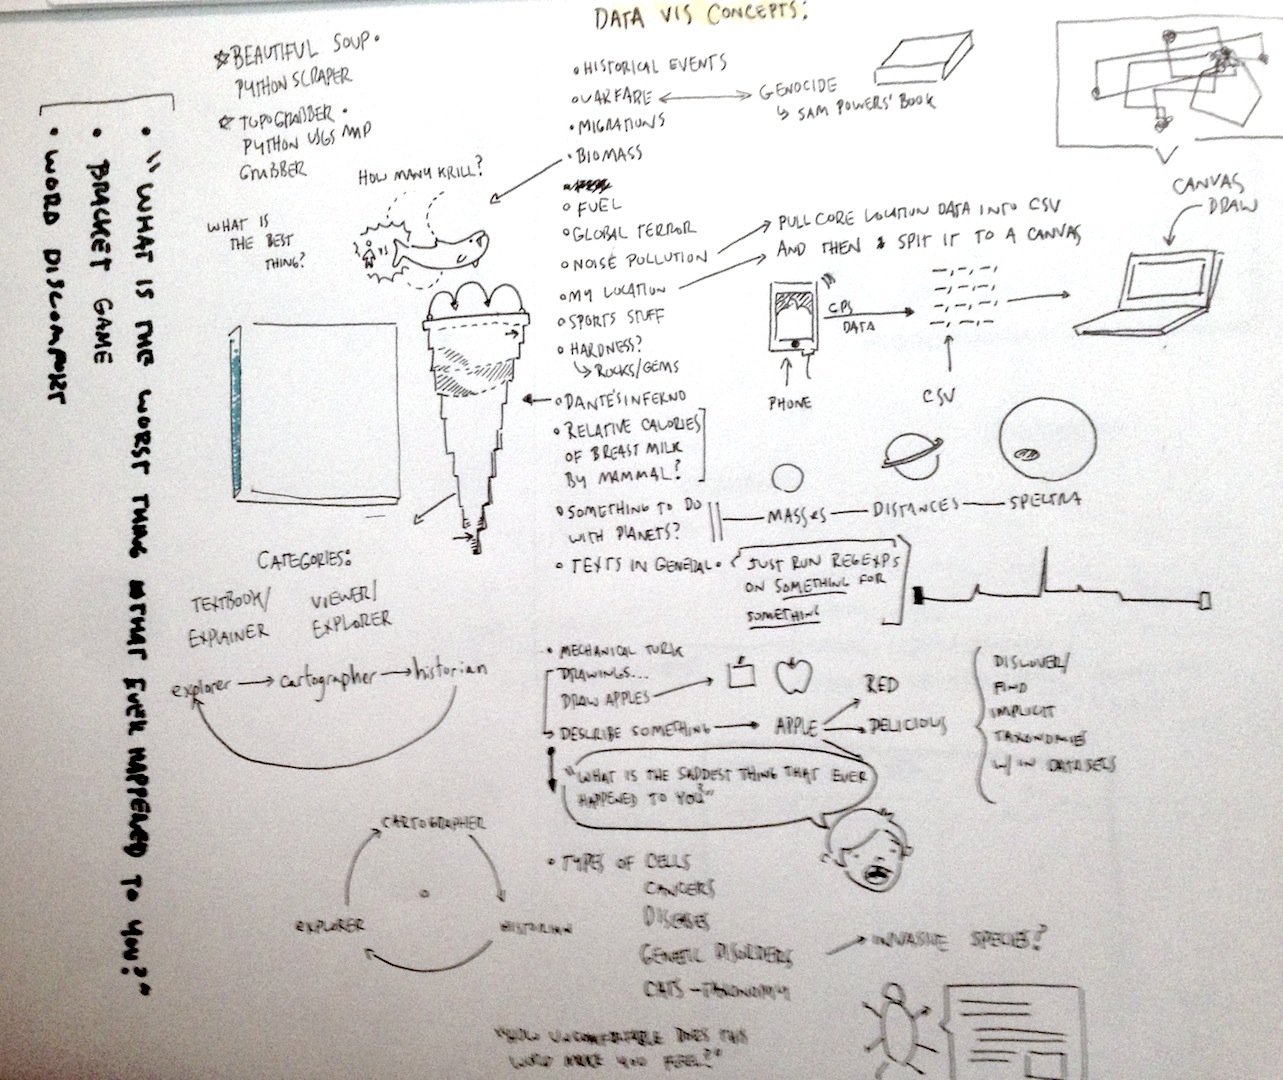
While trying to decide whether I want my next project to focus more on InfoVis or GenArt I definitely find myself stuck somewhere in between. What I do know is that I’m fascinated with 3D forms and physical artifacts generated through code, and, in particular, would love to explore means of being able to create unique objects through making sounds (singing, talking, screaming, etc), which reflect the nature of the sound. Below are a few nifty things I stumbled upon while exploring that space.

…But Narcissus & Nemesis

http://www.new-territories.com/blog/ncertainties/col12/scenariopair/luisandriana/

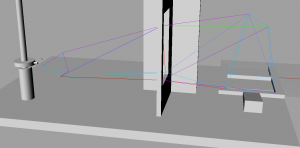
Let me be totally frank: At first, I had no idea what this was, and I clicked on it mainly because I was sick of looking at post-modern architecture and saw a link with alliteration and mythology in the title. In retrospect, I still am not sure I know what this is. Things I do know: 1) there are a lot of calculations going on here, 2) there is a lot of poetry and metaphysics going on here, 3) the presentation style leaves it incredibly ambiguous as to what falls under category (1) vs. (2). 4) Design fiction or fact, I’m a little bit obsessed with it. Maybe a lot.

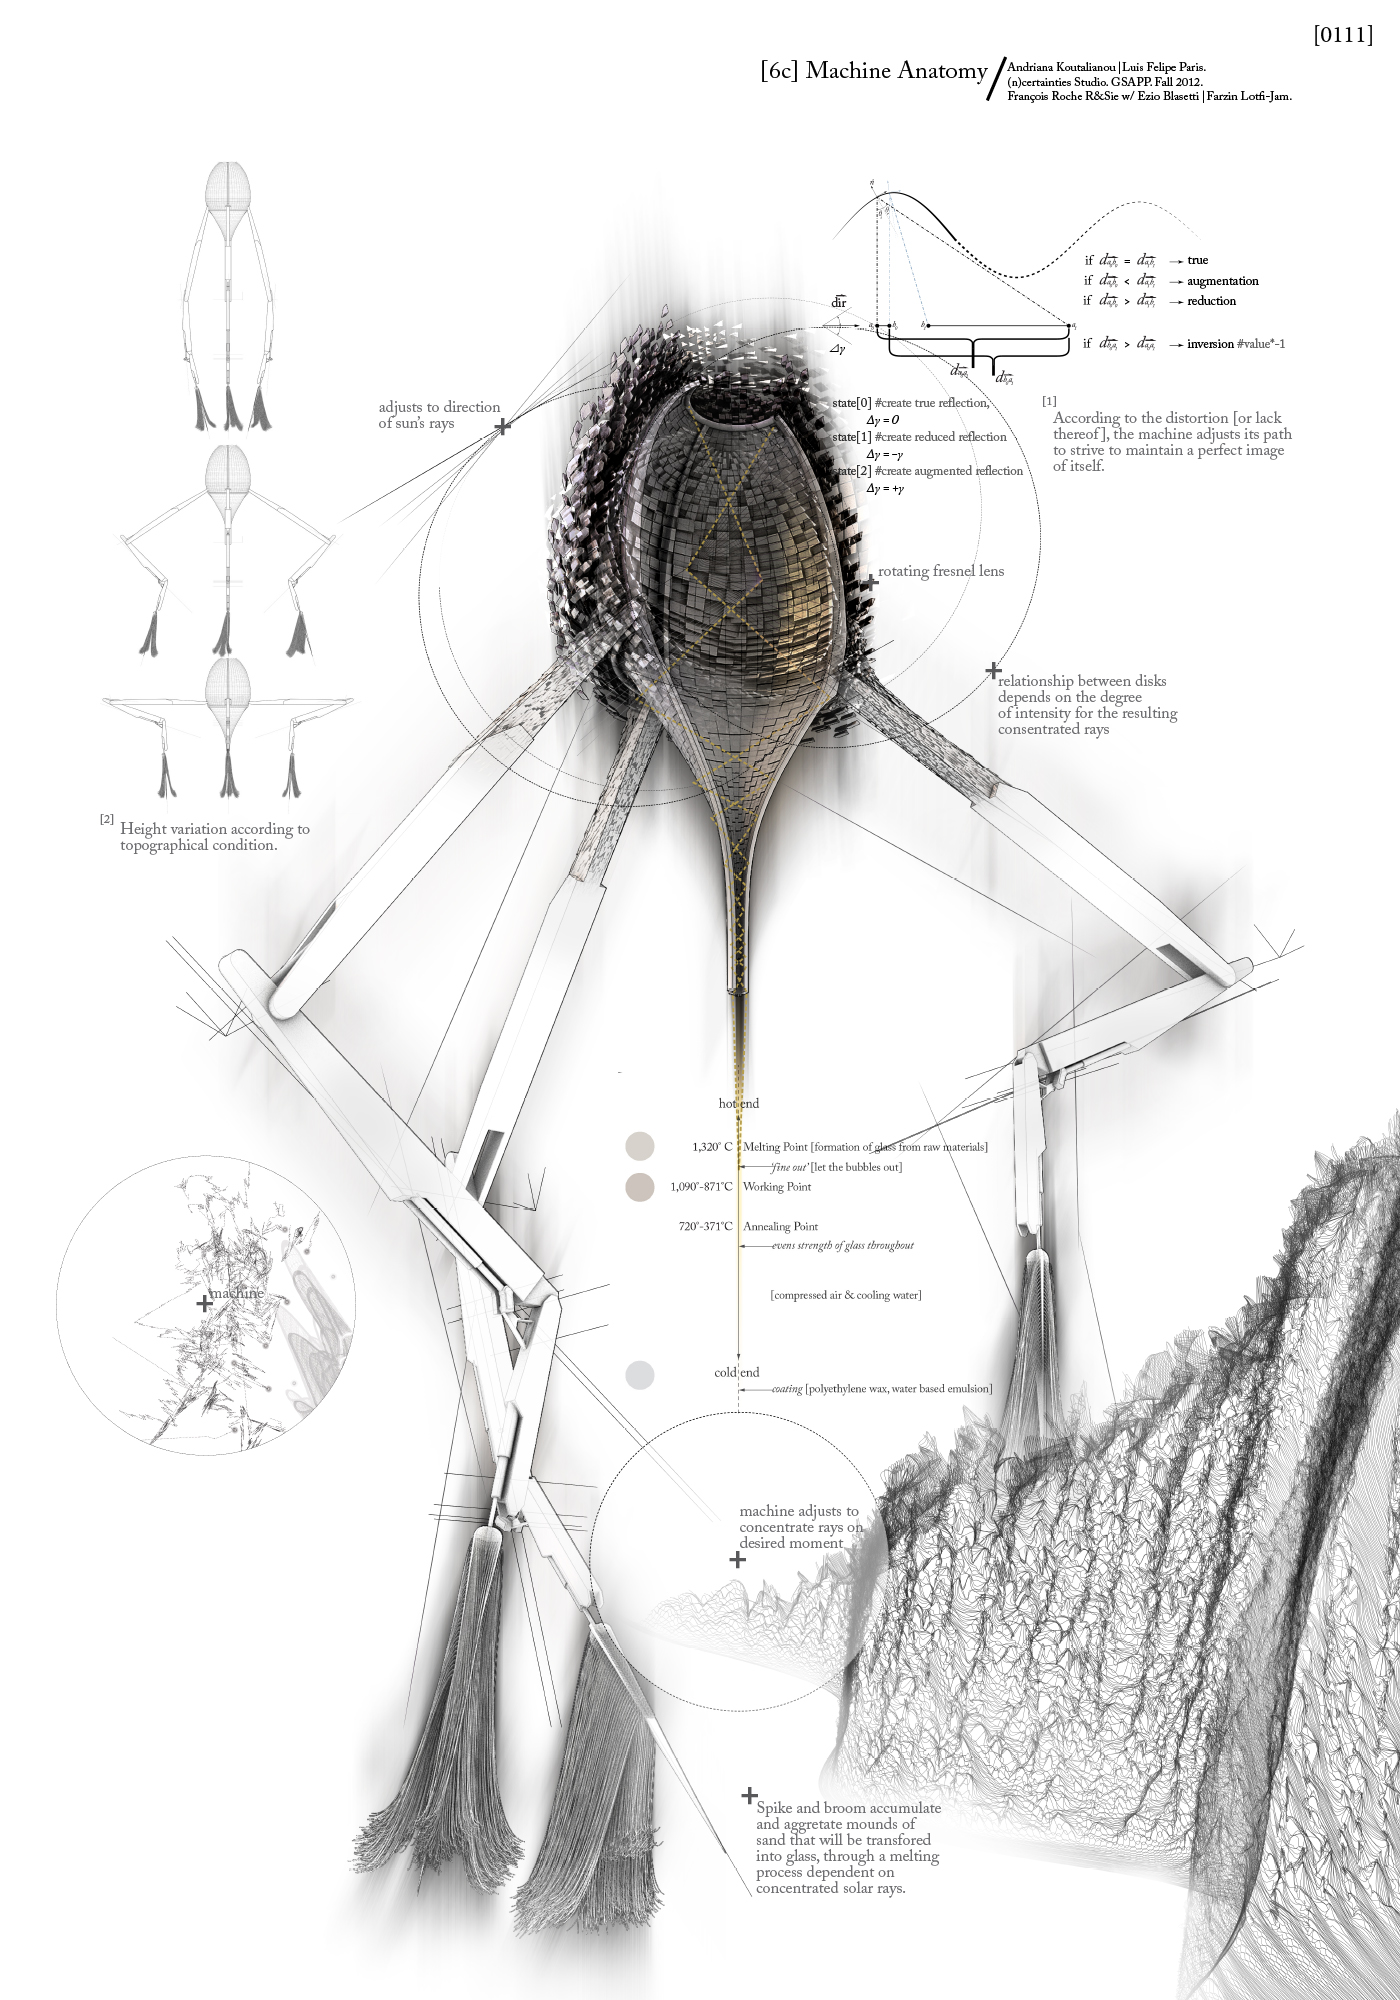
I think the most interesting idea contained in this piece is that coded generative behavior can stem from something higher and more abstract than math models, biological transport systems, cellular behavior, plant growth, or basic instincts like hunger or fear. Here, the ‘machine’ is driven by the weighty and cerebral desire to ‘maintain a perfect image of itself” as it continually moves and melts sand into glass. As the environment shifts and the glass causes distortions, the machine must move, but in doing so, creates more distortions in its environment…. it all just screams kafka novel to me.

So much of this system is entirely narrative. You could, I suppose, invent any number of stories to superimpose upon the graphs generated by the code, but the fact that the code seems to have been written in order to bring this story to life, and to address such an interesting concept of self-image and paranoia, anxiety, identity, makes this piece stand out among other examples I’ve seen. It’s also fair to say that I may have interpreted the thing entirely wrong, and it doesn’t really matter to me, because I’m still moved.

ShapeShift
http://www.caad-eap.blogspot.com/p/exhibition_15.html

I was a MatSci geek in undergrad, and did a lot of experiments trying to create piezoelectric ceramic thin films. I liked the idea that a material that looked rigid and immoveable could take on a completely different character in the presence of electricity. From what I can tell, there’s no real code in this demo, but I appreciate the potential for interacting with this material using code. Consider, for instance, talking into a microphone, and watching the material cringe away from the words you say because of the way you said them. In a way, that’s both visualizing information, and generative art, but both are embedded within the polymer itself!

Digimorph
http://digimorph.org/

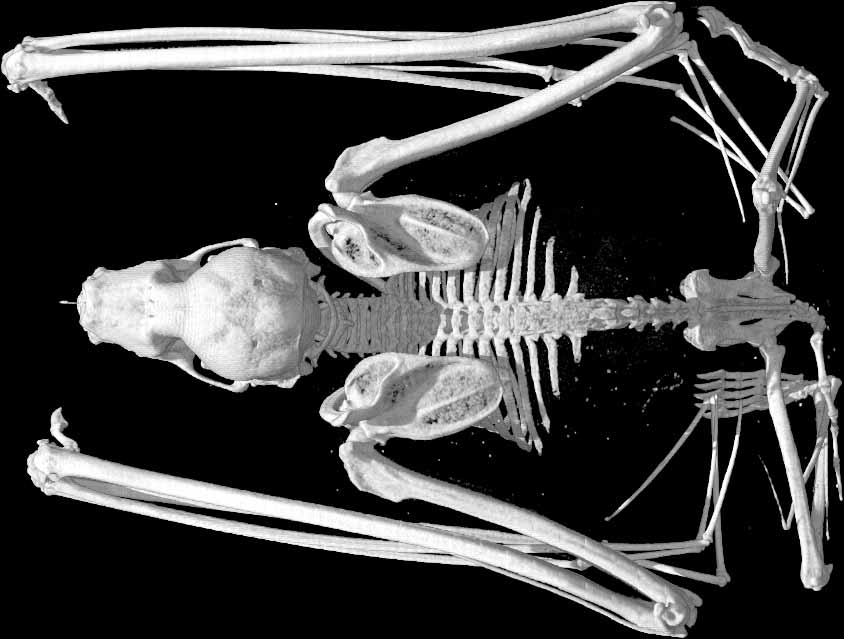
Um, no, this isn’t some odd genetic hybrid of Digimon and the Animorphs—but it does have something to do with genetics and weird animals. As the website explains (if you can suffer through its rather ugly design), this is a database of hi-res, x-ray computed tomography of a whole slew of animals, living and extinct. I’m including it both because they have a fairly interesting description of what goes into generating these scans, and how the computer constructs X-Ray tomographs from fragments and slices of images, and because it could possibly serve as an incredible database to mine for an infoVis project (there has to be a better way to display all these amazing images than that website! yikes…)