I spent a long time considering what to visualize and how to get the data make something compelling. I’m very anti scrape-and-see w/r/t these sorts of projects because (a) I’ve done that before and (b) I think scraping big text files for key terms is misleading and generally not as interesting as a lot of people seem to think.
So while I was ideating (as we designers do) I remembered a funny thing that happened this summer. I was at a hippy parade thing in Seattle (as you do) and I overheard a five-year-old kid ask his father “what’s the worst thing that’s ever happened to you?” which was the funniest and most amazing question for a little kid to ask anyone.
Anyway, that got me thinking. What would it look like to visualize answers to that? How would I aggregate those answers in a meaningful/compelling way? I’m not sure yet, but I’d like to find out.
That’s the first idea.
The other two stem from a similar germ of asking people to make spontaneous decisions and then using those decisions to model something (what, exactly that is, I’m not yet sure).
Idea number two is this: ask people how uncomfortable a series of words makes them and rank them.
Idea three is a universal bracket (a la the NCAA tournament) where we start with 32 sets of binary pairs which are then filtered to 32 winners. Each winner is then randomly paired with another winner then paired down and so on…I’m pretty sure this process might scientifically determine the best thing ever.
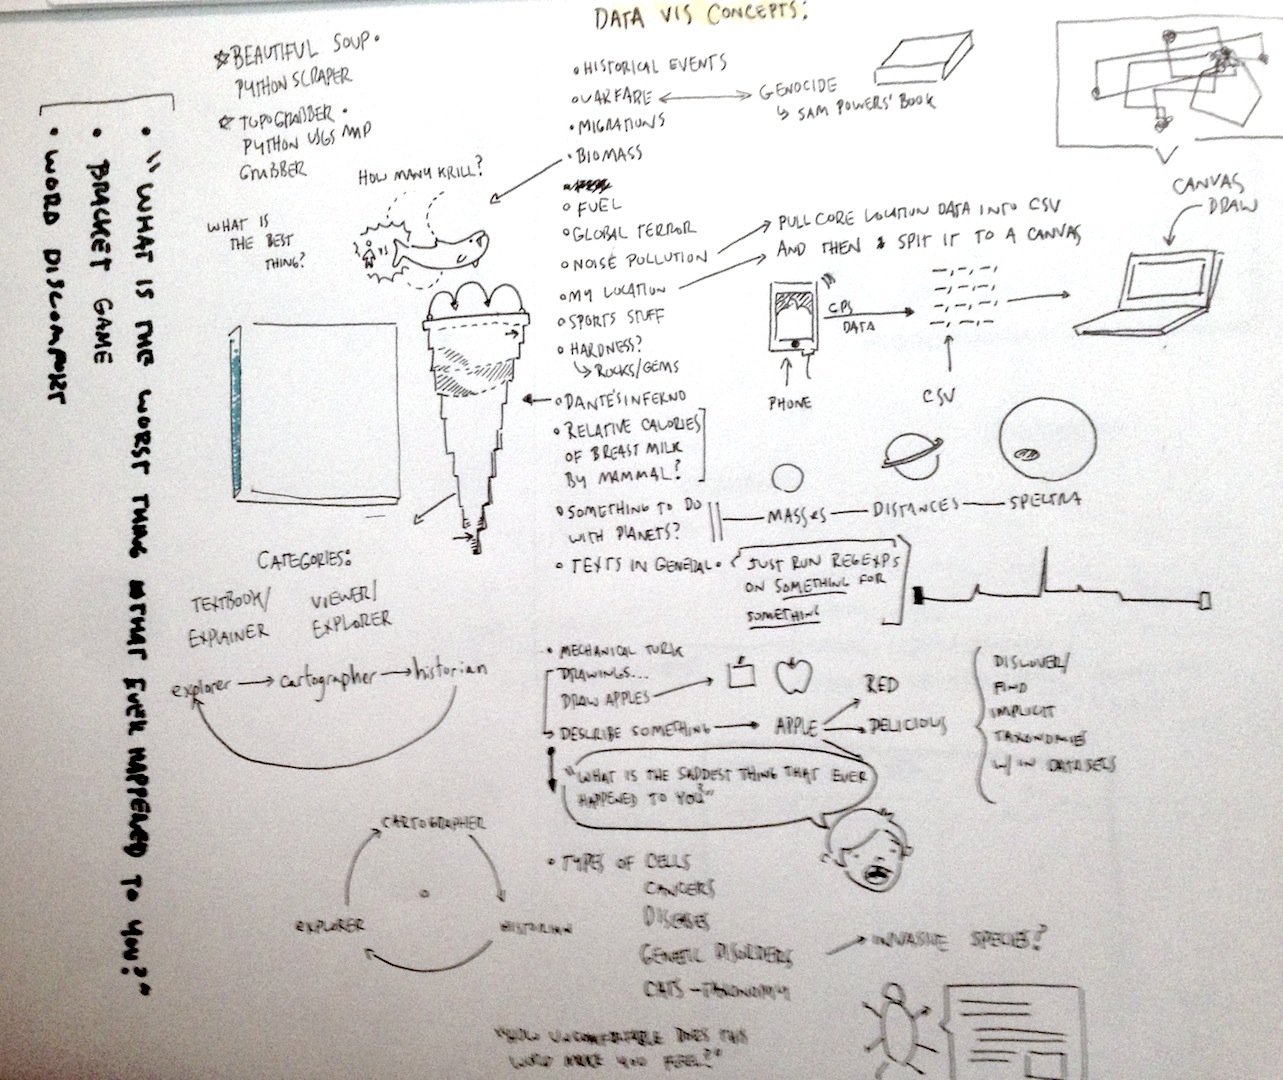
Here’s a photo of my sketchbook (where the magic happened):