You may already know the projects before, the following three looking outwards is my favorite. Because it is not only about graphical eye candy, but within the context of great story.
We feel fine.
– by Jonathan Harris and Sep Kamvar
http://www.wefeelfine.org/
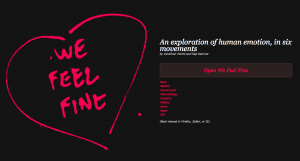
There is also a book version, but unsexy I think. The data comes from blog posts from all around the world. Sep and Jonathan scan new blog posts as they are published for the phrases “I feel” and “I am feeling” once a minute and thereby have collected over 12 million feelings since 2005. The database is growing by 15’000 to 20’000 records per day. The inspiring part of the work is its humanity part, all about collective experience – everyone’s everyday feeling – not only beautifully designed graphs.
Wind Map
– Fernanda Viégas and Martin Wattenberg
http://hint.fm/wind/index.html
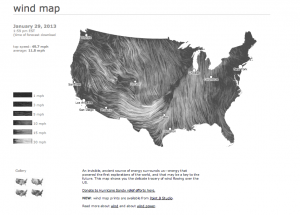
The great part is that the creator make the data visualization with live meteorological data. This is so straight-forward for see the wind for a bigger perspective. I like it because I is a new way of journalism – current news, fresh objective data present to all.
Immaterials: Light Painting WiFi
Immaterials: Light painting WiFi from Timo on Vimeo.
This work present the invisible. Unlike other data visualization, it is not limited in RGB pixels, but at bring the intangible via photographs.