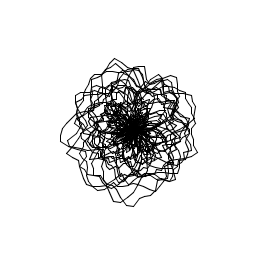
A Data Generative Art Project: Global Economy Rosalization
I used Processing to visualize global economy in an artistic way. The flower-like Lines Sketches are generated from four key index date from IMF. More information about the data are in the end of the passage.
Before I get the data visualization project, I pay attention to World Economic Forum in January, and had a glance of the Report. The global risks is especially interested to me, but the data charts and forms are very difficult to read.I feel, as a general reader, I am not read the data as serious as professional analysts. Instead of reading the data, I am feeling the data. So I choose global economic related visualization as one of my initial ideas. I want to the data to be more impressive, generating more feeling in the common reader, the data not only serve as a media facilitate reading (Even thought I feel this goal is not achieved when I read the wef report).
Also, I feel meaningful data generative art is not only an random generative fun/eye candy, but interpreting one media to another – to build a bridge between different dialogue. Maybe the interpretation is not very powerful/impressive, but I learned how to interpret by interpreting the economic to roses.
I chose Processing as my coding environment, and started by drawing a line-rose with some magic numbers. The picture is pretty rose-like. But after using the real data. The economy of the countries kinda freak out, not like a rose at all( or like a crazy rose).

I basically learn coding/processing by myself. During my time writing this, feel my code is not well written (I feel puzzled at when there are more than one ways of writing it but I can’t tell which is the better way),for example, not-efficiency, bad structure. I want to write elegant code. If anyone could take a look at my code at github and pointing out some problems, I would be very glad! (Thanks in advance!)
http://www.weforum.org/reports
I have to admitt:
Finally, this is the source code at git hub
https://github.com/mengs/EconRose
PS: About Data
Data Source:
October 2012 World Economic Outlook
IMF http://www.imf.org/
Selected Data Items:
GDP
Inflation
Population
Government Revenue
Total sample:
185 Countries