Quantified Spencer:
My transition from high school to college through weekly planners.
As a senior in highschool I started keeping weekly planners. These planners are a combination of calendar, todo list and weekly goals. I have saved these planners since the beginning. I could not resist using this dataset.
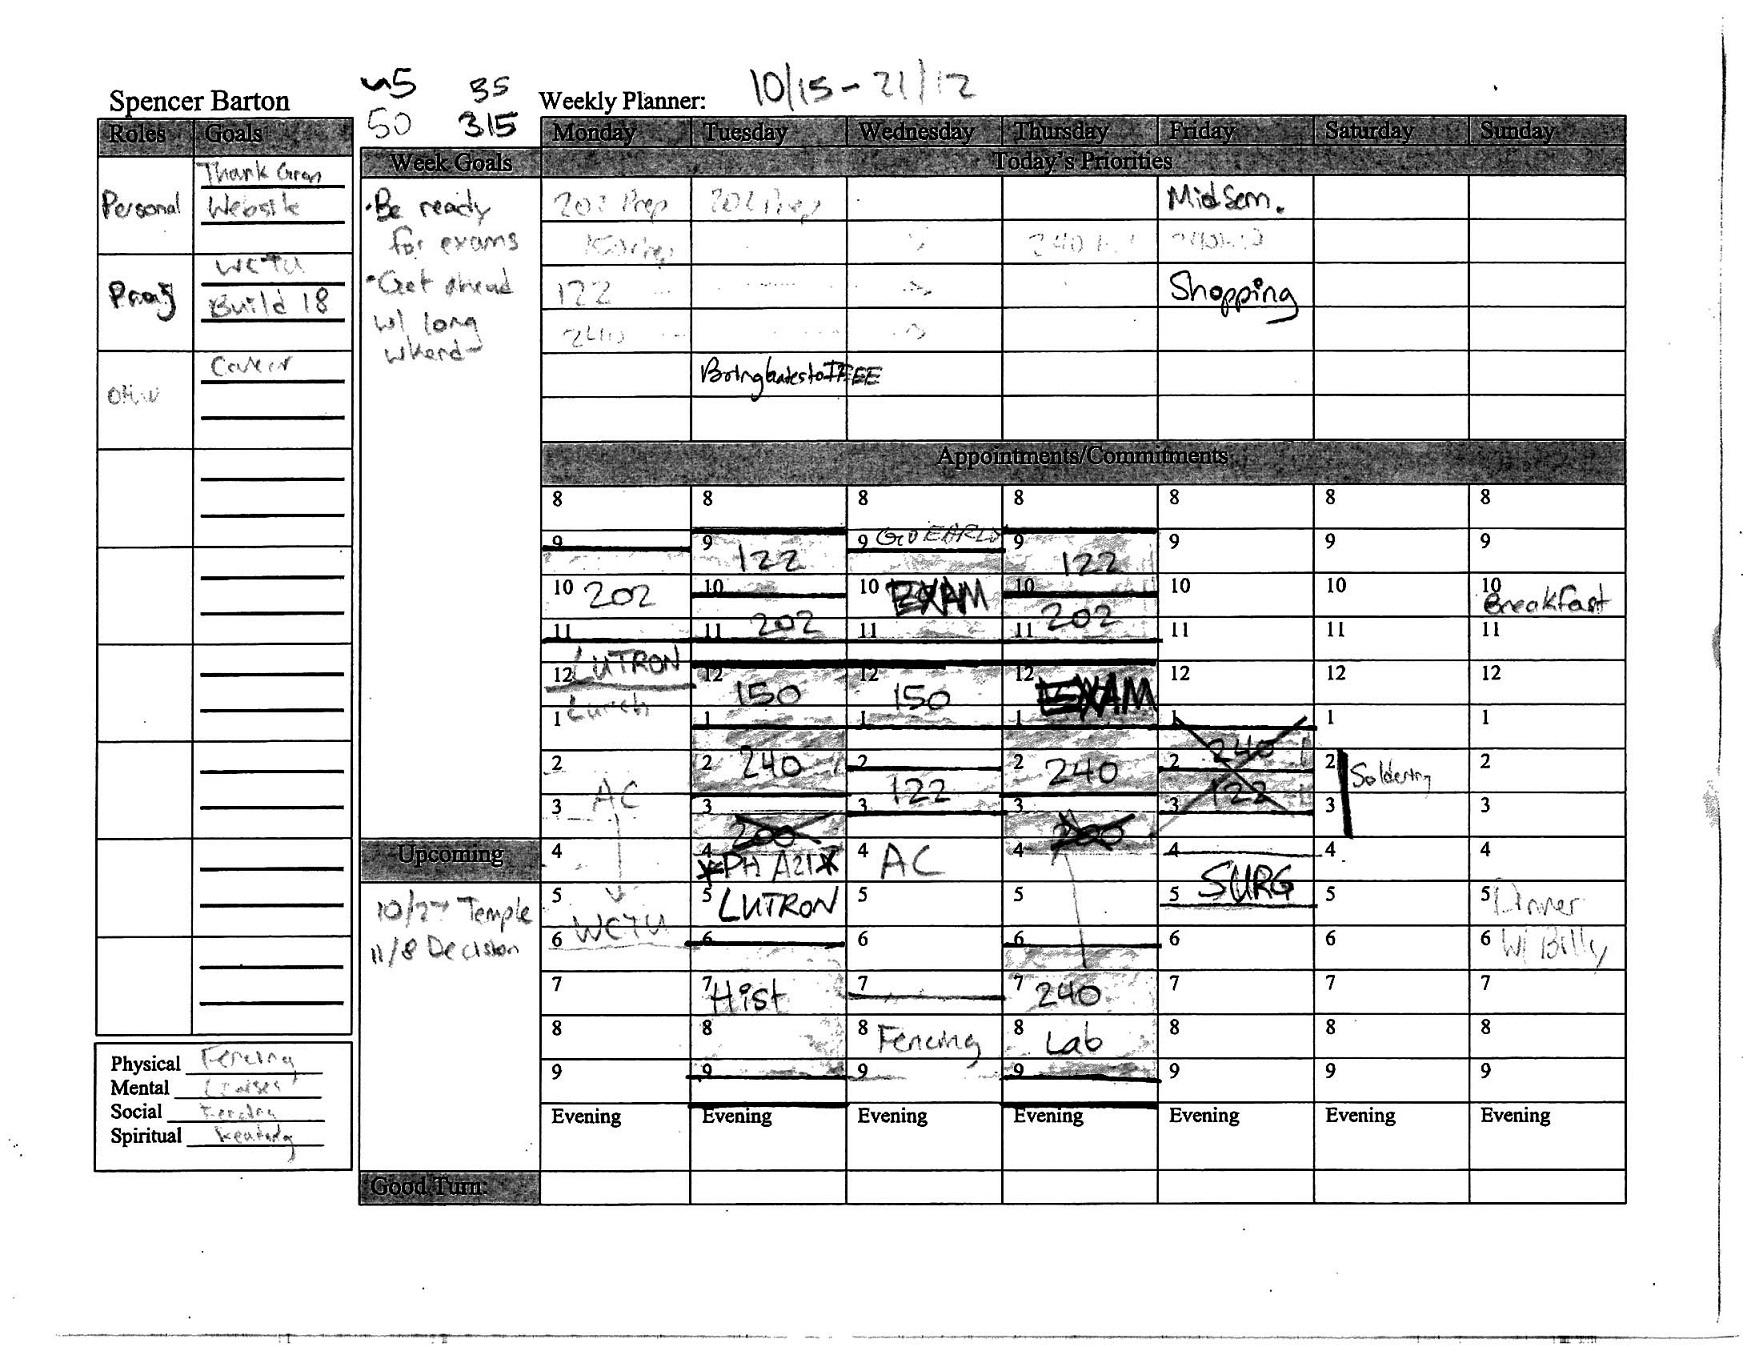
A planner from high school:
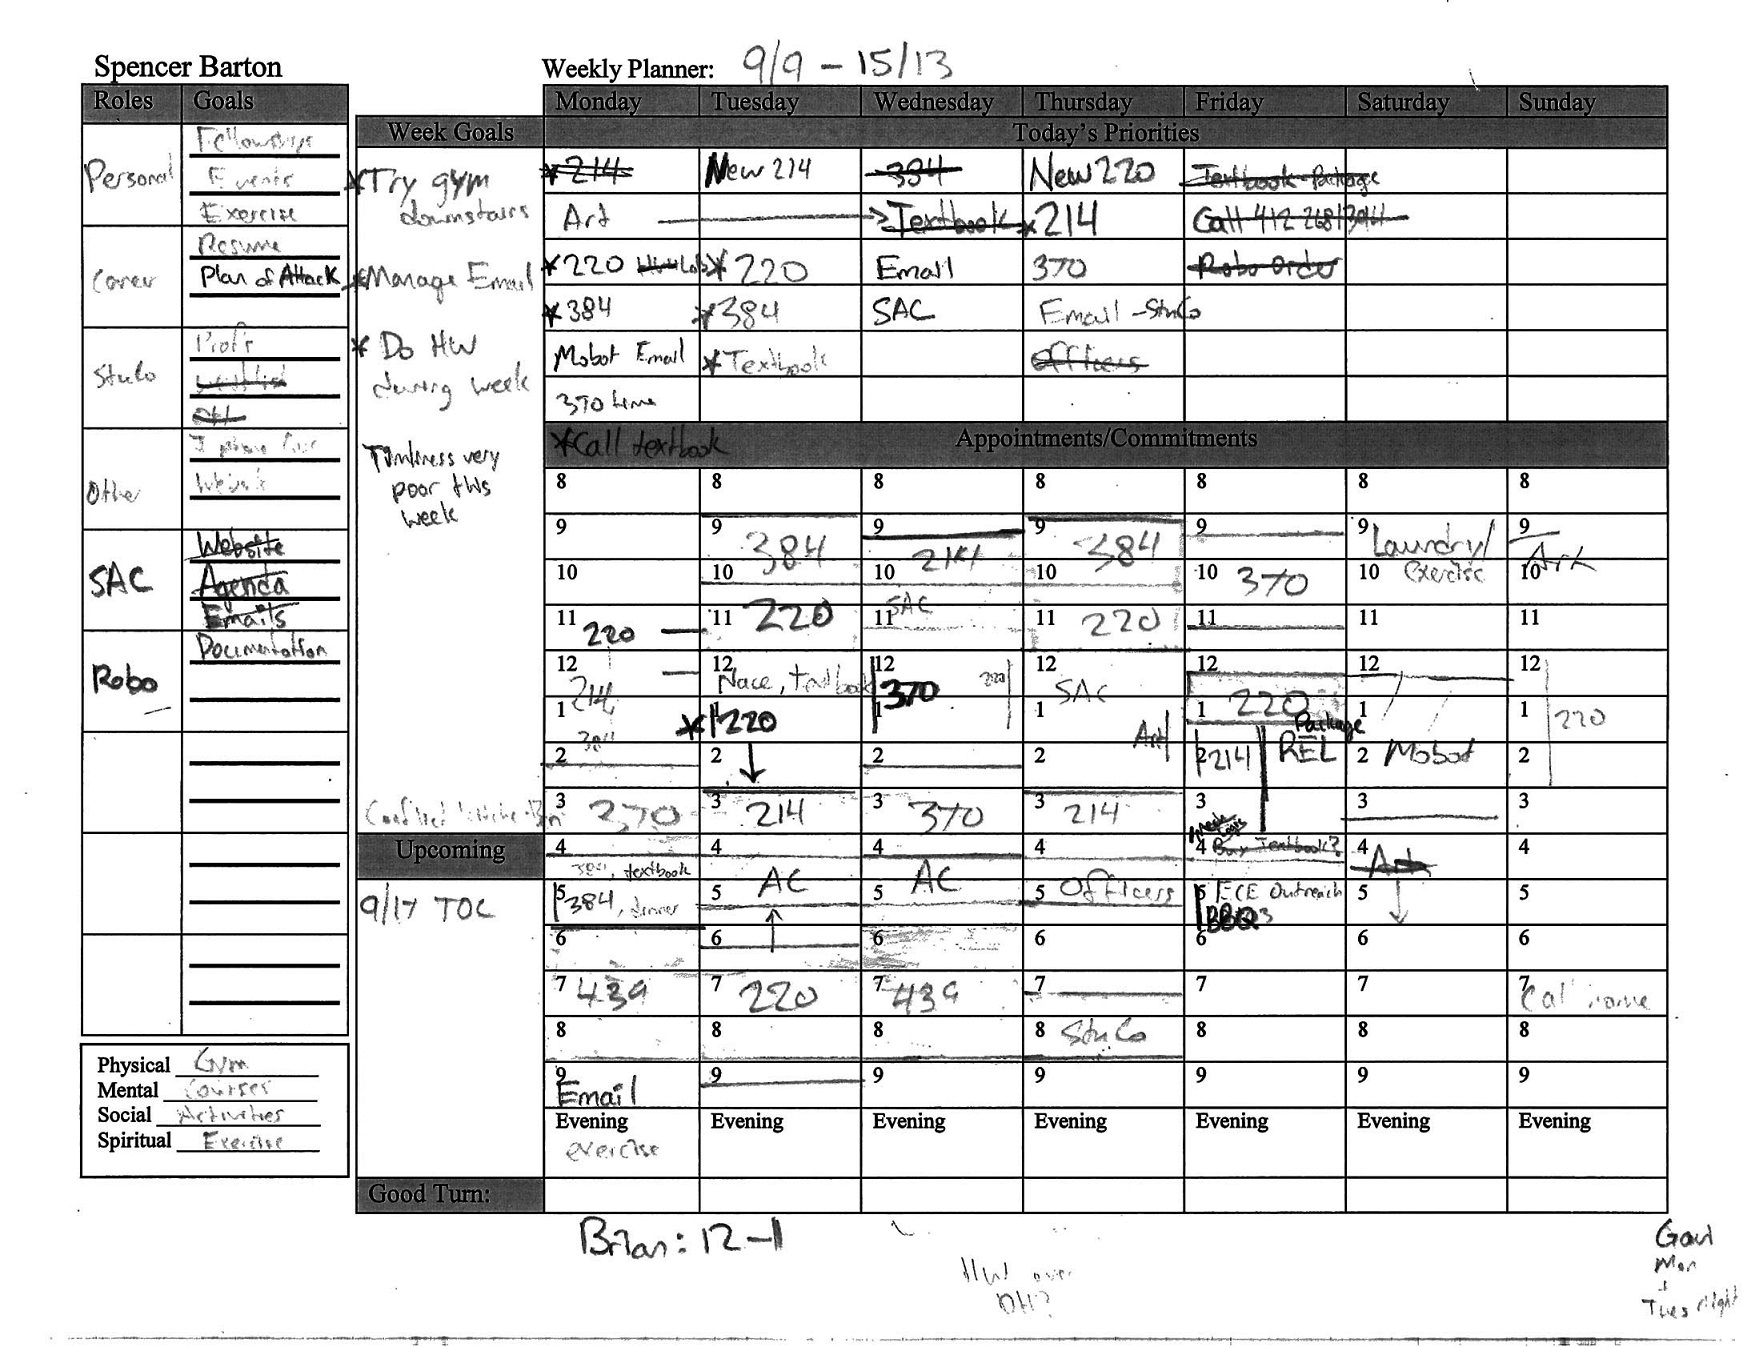
Because my planners were all on paper I decided to focus in on a few key elements of the data.
A brief aside – why do I keep all this stuff in paper? Google calendar works much better you might say. I use paper because I have complete control. The interface is however I envision it and data entry is never constrained to text boxes.
For this project I focused in on data in the left half of the planners: the roles/goals category and the week priorities category. The roles/goals category is a todo list organized by activity. For each activity in my life I would then have at most 3 goals. The week priorities category is for goals during the week or major things happening during that week that I wanted to make special note of. I focused on these boxes because these lists contained data with sufficient granularity without the minutia of calendar events. These goals represent the focus and aspirations in my life week by week.
Before continuing into data parsing and analysis it is important to note first that these planners are a variant of Stephen Covey’s version from “7 Habits.” I read that book in the summer before senior year in high school and began with these planners. It is also important to note that these planners overwhelmingly represent my time during school.
A Categorization of Spencer’s Life
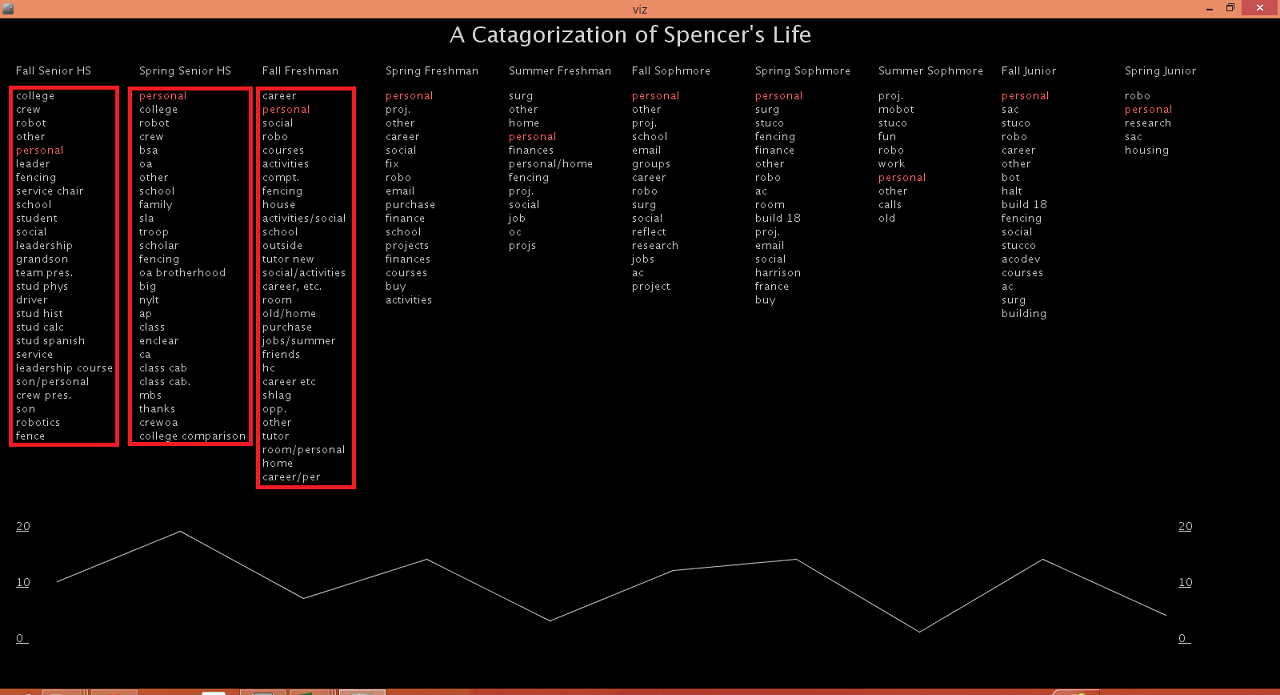
My main visualization focused around the roles/goals section of my weekly planners. I decided to examine just the my roles over time.
Roles represent the major segments in my life at any given time. Most of these things are activities: Boy Scouts, Robotics Club and Fencing. I felt that the most interesting component of this data was focusing on the frequency of occurrence over time.
I created a frequency visualizer in Processing. Activities are organized into groupings by times of my life (high school, summer after Freshman year, etc.). Within each life bucket the activities are ordered by frequency with the most common activities on top. The list of words is a bar graph showing the spread of activities. When you mouse over an activity, that activity is highlighted across time and a line graph is displayed below showing the frequency.
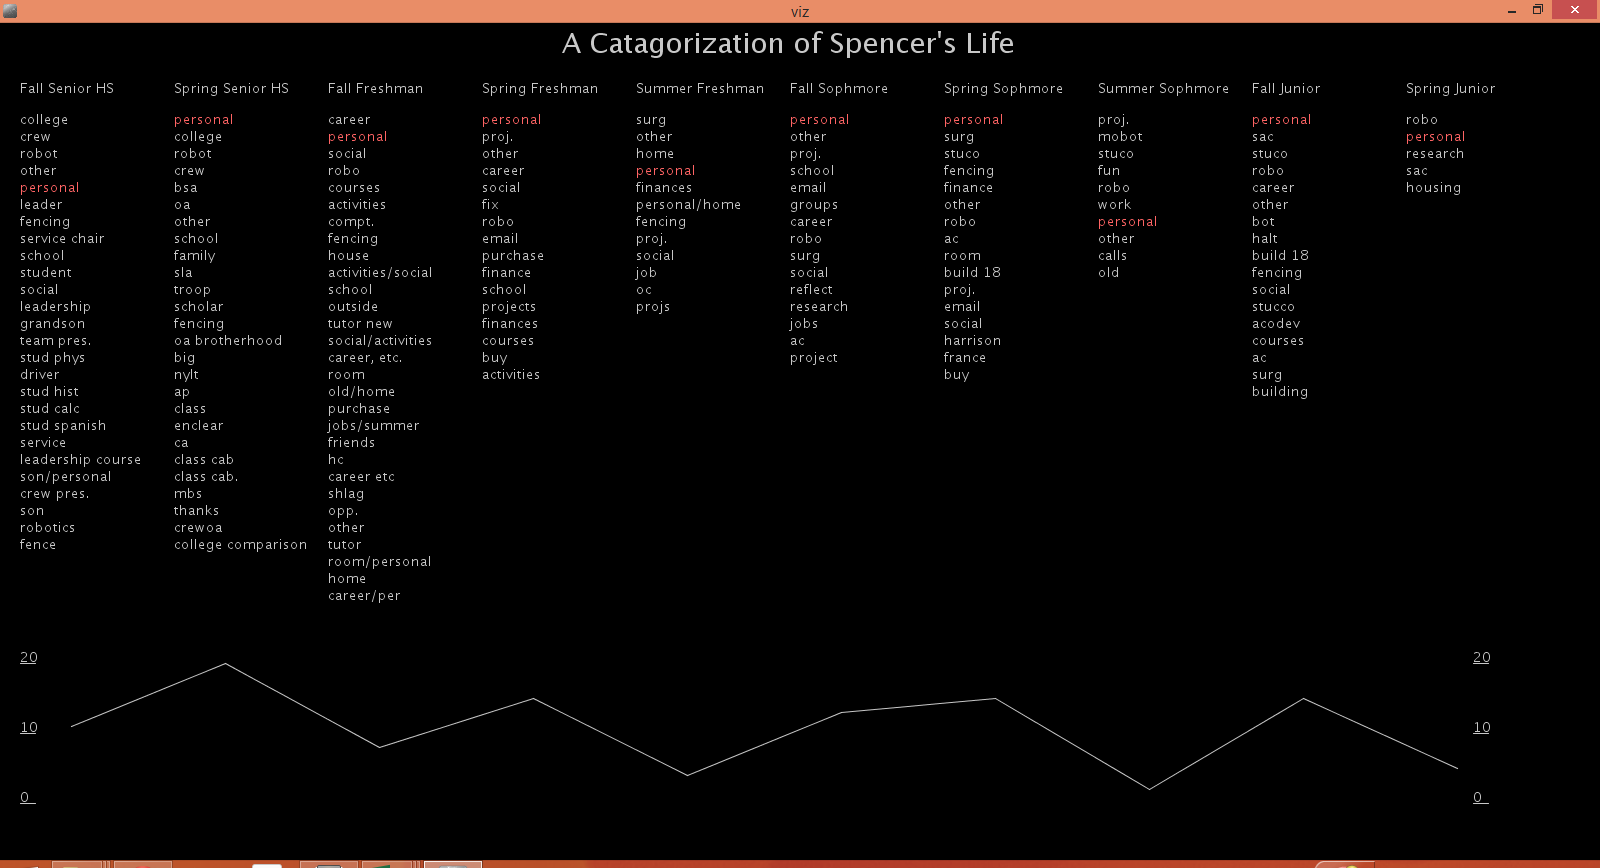
Live page on Github. Code also on Github. Please take a look at the README before diving into the code – it is a mess and will likely never be cleaned up.
Focusing in on the Data
Summary Statistics
I started by looking at a few bits of summary information:

As you can see I started keeping planners at the end of 2010 (senior year high school fall) and have been keeping planners since then. I’ve been fairly consistent about filling them out since then though it is worth noting that I never completed all 52 weeks in a year. This is mostly because I did not fill out planners during breaks. This can be better seen in this graph of the number of planners by month:
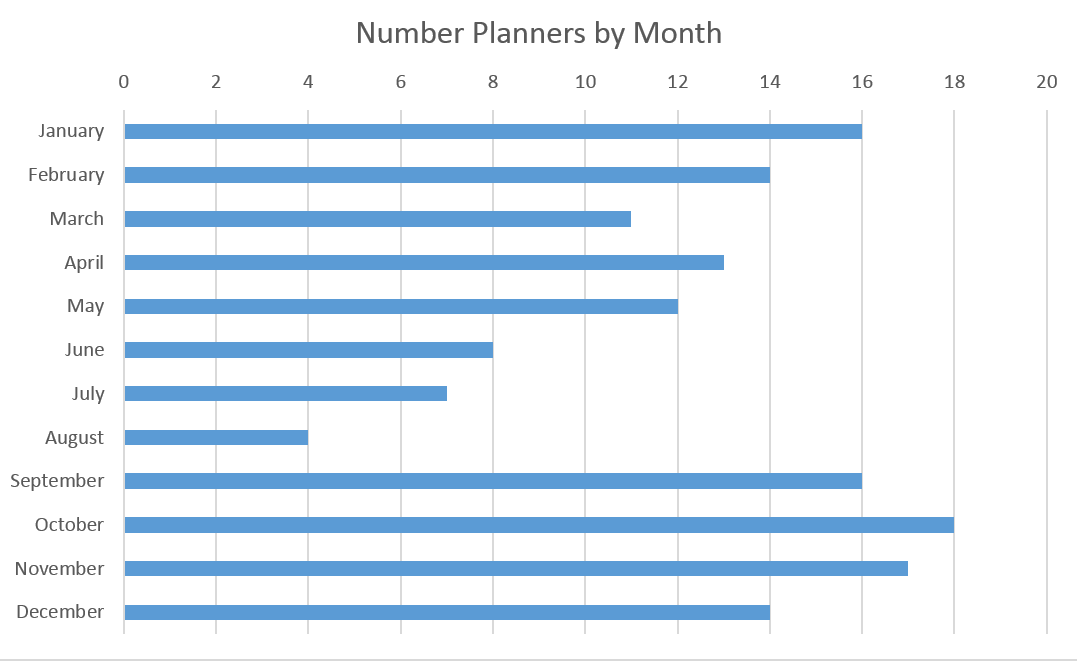
The months were I am in school as the most heavily represented. I only really need time planners when my life gets complicated/stressful so the summer is significantly less represented. I did still fill out some planners in the summer, particularly when I had a job the past two summers.
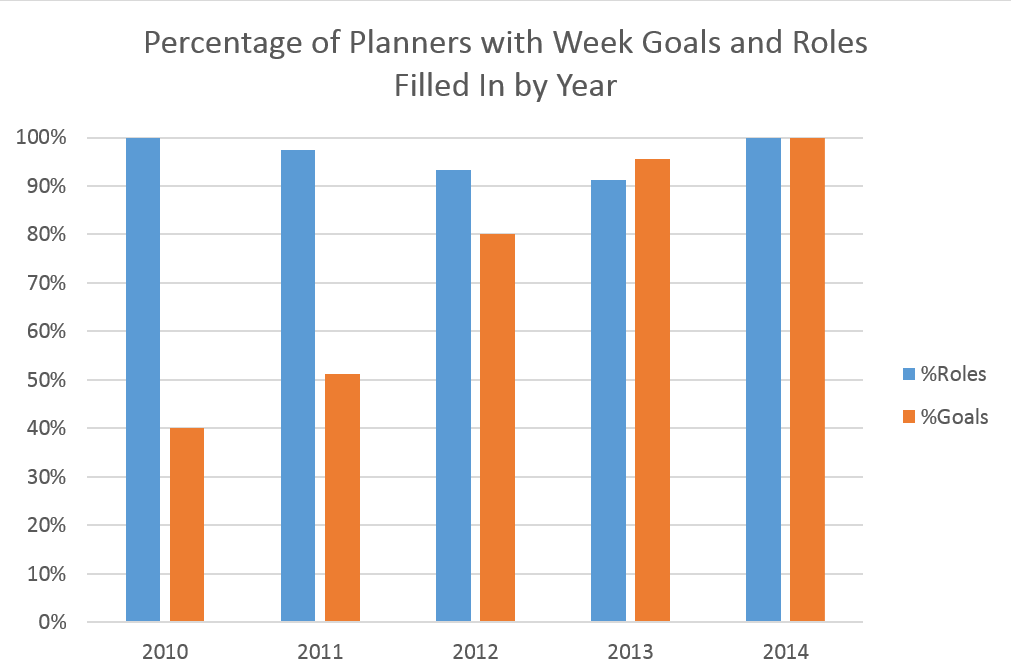
The above chart shows usage patterns over the years. I focused in on only two sections of the weekly planners: the roles/todo list section and the weekly goals. As can be seen I started using weekly goals much more in my college years. I think this has more to do with the structure of high school work versus college work. In high school assignments were daily so there was less need to write weekly goals looking at longer term projects. Life in high school was also much less complicated.
Specific Insights
One of the first things that I noticed in my visualization was that I was more active in high school and first semester freshman year. By active I mean that my spread of activities was greater. This can be seen in the visualization by noticing that there are more activities in the first few sections in my data. This seems to refute the data above that shows high school to be a simpler time based on goal writing. However, I think that the real insight here is that while I was more involved in high school, life details like social activities and laundry were more a concern in college which resulted in more goal writing.
I found the social category interesting and I noticed a pattern:
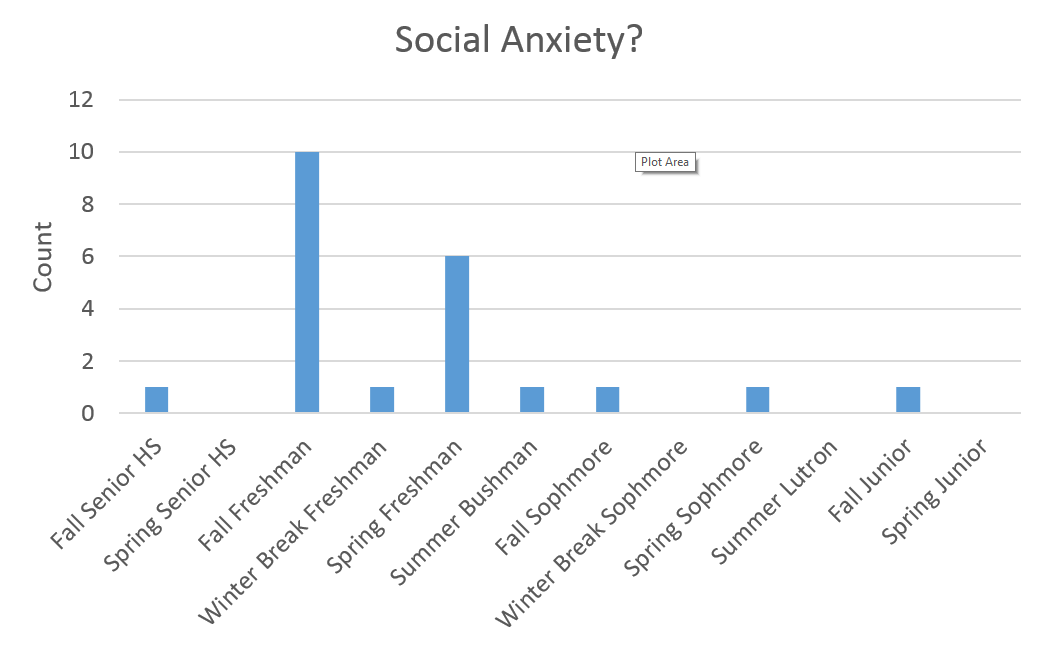
Apparently I was feeling socially anxious enough to put social activities on my todo list during my first year of college. As for after freshman year I would like to think that I became more socially mature but perhaps work simply drowned out the social stuff. Also of note, In the chart above Summer Bushman and Summer Lutron refer to where I was working. There were no records for the summer between high school and college.
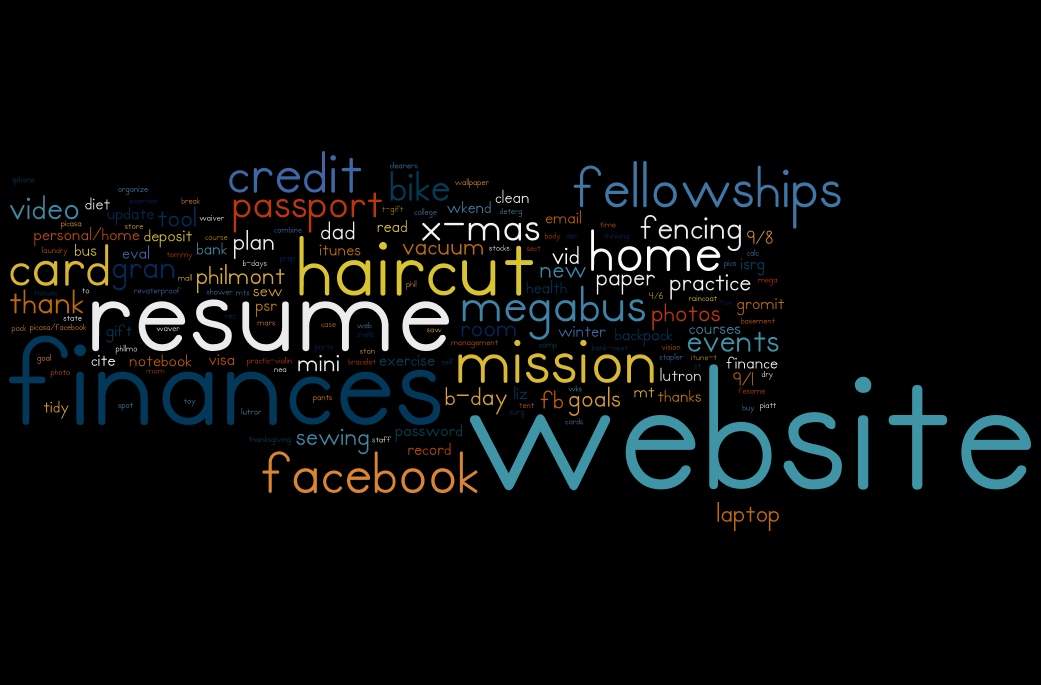
Speaking of fun and work, below is a cloud of common words in my weekly goals.
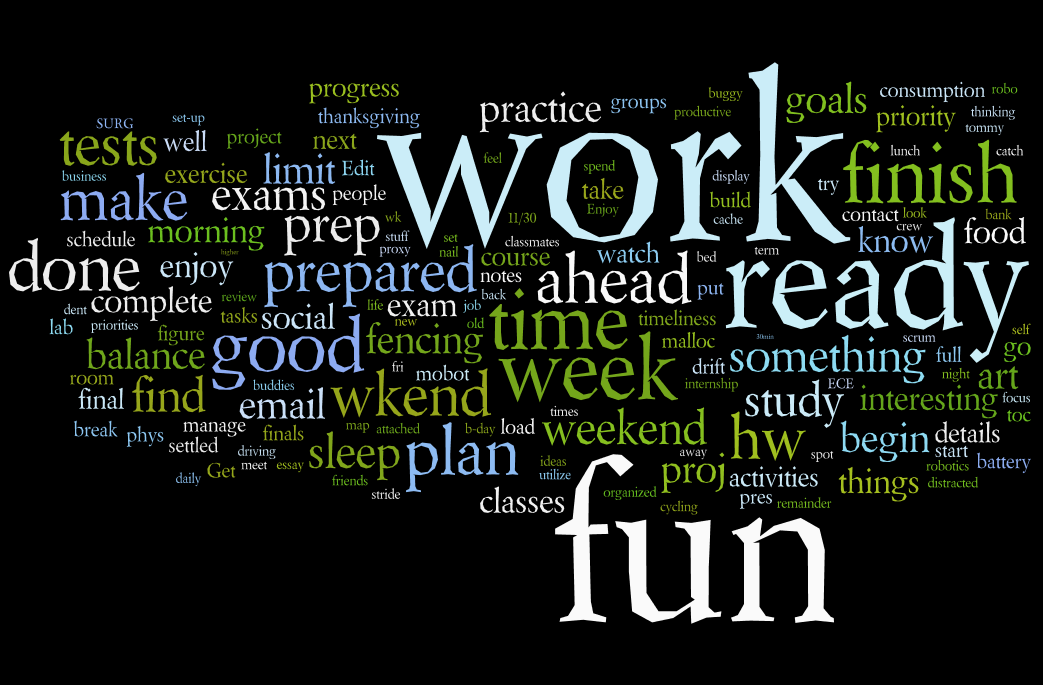
Fun and work seemed to trump the others. Work was not a surprise as it is common for me to write weekly goals like “work on my website.” Fun was a bit of a surprise. I decided to dig a bit deeper by looking at frequency over time:
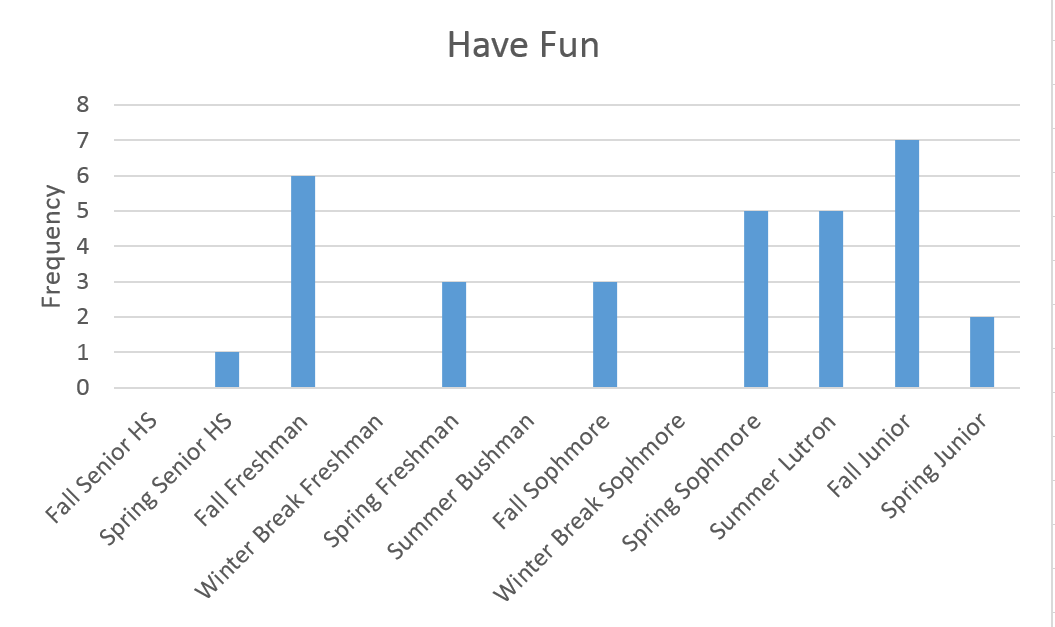
I really started to tell myself to have fun in college. By telling myself to have fun that usually meant that I currently wasn’t having fun or felt stressed. It is interesting to see spikes my first semester and a rising trend in recent semesters (note that I am currently in Spring Junior). However I find it more interesting what happened between semesters. Most breaks I felt no need to tell myself to have fun except for Summer Lutron. Last summer I worked at Lutron Electronics and I did not enjoy the experience – perhaps it shows?
Other Findings: Website
A look at the specific tasks associated with the personal category:
For some reason I’ve been putting off creating a personal website. This is apparent when I look at the personal category above. I started writing website as a task beginning sophomore year a few weeks after the career fair. I’ve been writing it as a goal since then and well its not done yet. Here is that first occurrence of the dreaded website:
The Process
A large part of this project was spent digitizing the paper planners.
Image Processing
I went through quite a process to extract the images
- Scan planners, convert format
- Rename planners by date manually
- Photoshop routine for contrast and rotation
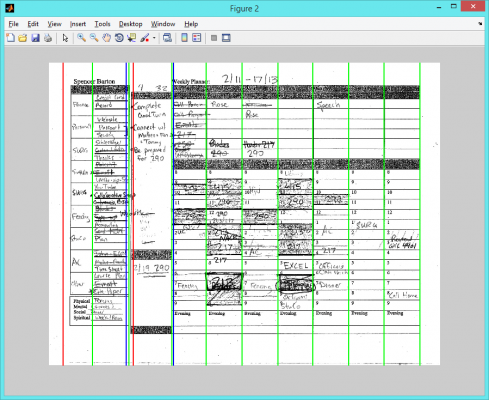
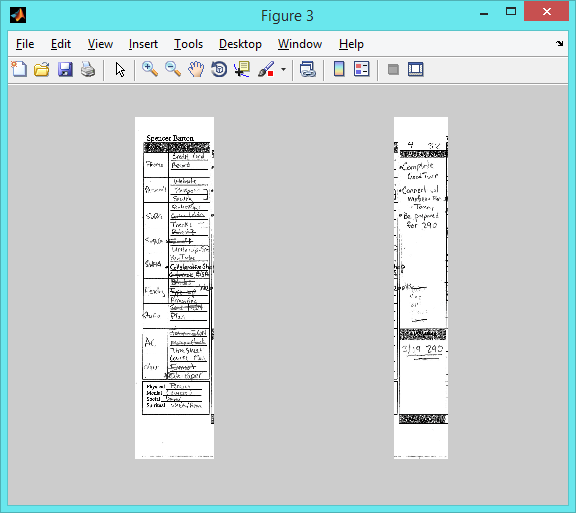
- Edge detection and separation into role/goals and weekly goals with Matlab
The Matlab scripts did some edge detection and then found Houghes lines. The planners were then split using the found lines:
After splitting the planners I used Mechanical Turk to transcribe the text.
Amazon’s Mechanical Turk
Mechanical Turk is an amazing service where you put up a HIT (Human Intelligence Task) and hundreds of people simply do the work for you. This service is perfect for tasks such as text transcription where computers have more trouble.
To use Mechanical Turk I first created a HIT which is a simple HTML form that the Turks fill out. Here is what the Turkers saw for my HIT:
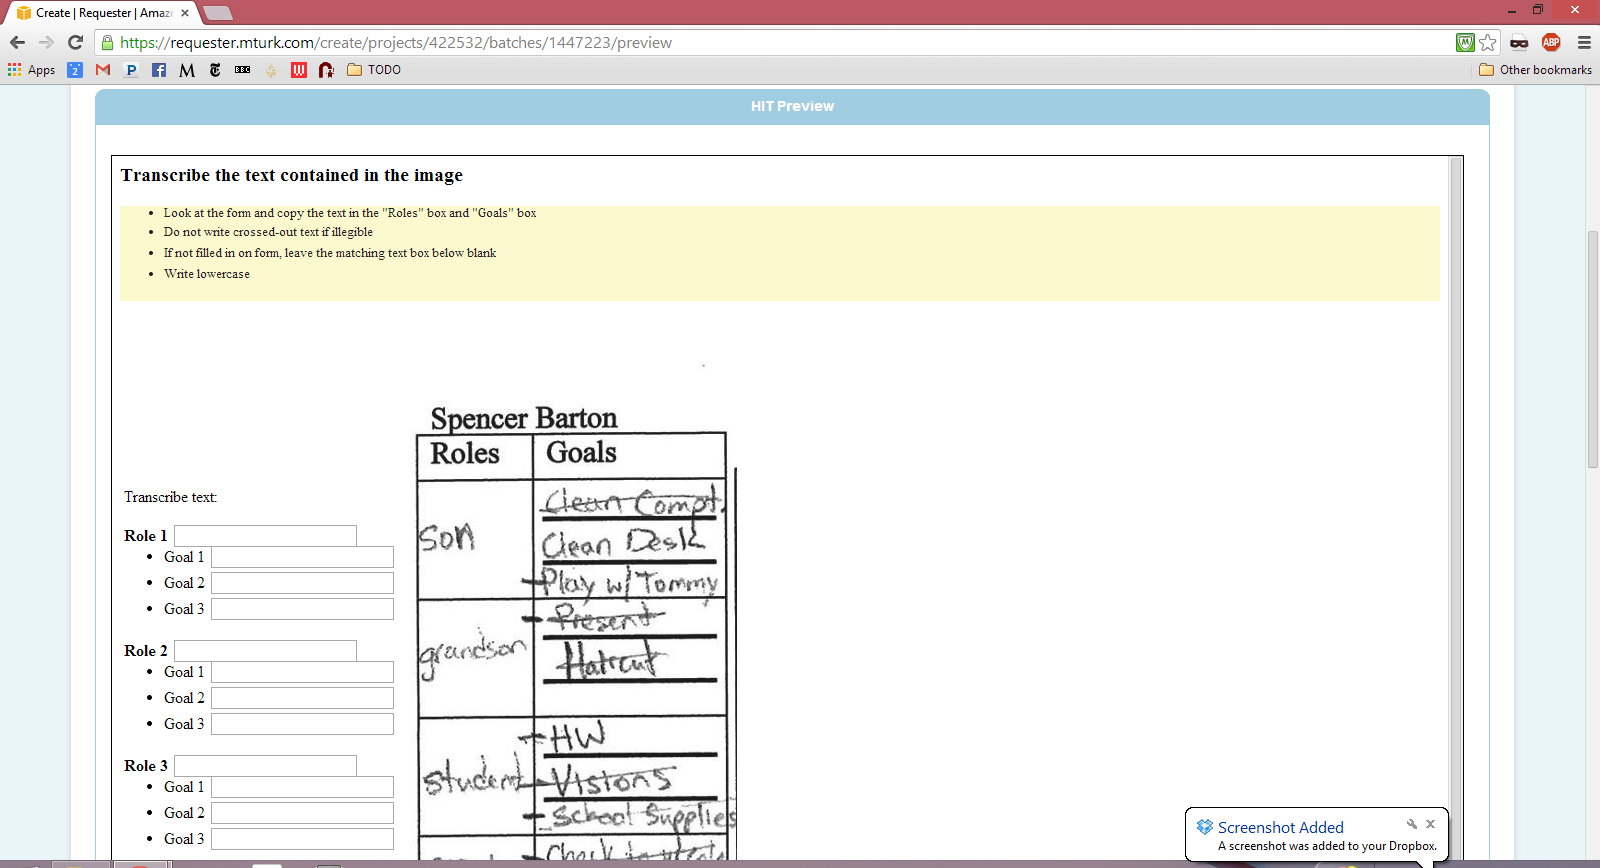
I created two HITs, one for the weekly goals and another for the roles/goals section. I offered 6 cents per paper for the weekly goals and 50 cents for the roles/goals.
Here is how the Turkers did:

The 50 cent task which had 140 transcriptions completed in a few hours while the other task didn’t finish in the 2 days I gave. Obviously there is a happy medium between 6 cents and 50 cents.
Feedback
My summary of the class feedback:
– Technical part good but needed more insights
– Too much (condense data)
– Focus on interesting parts
– Felton report is a great example
– Ask questions and focus in on those
– Need to spend more time diving into the data
Hopefully I have addressed some of these concerns with this blog post.