INSTRUCTIONALS» PseudoCODE Drawing
My initial attempt at the instructional drawing was a flop, partly because the outcome drawing wouldn’t necessarily be able to represent what the instructional was instructing was doing and partly because the commands just aren’t easy for a human to execute without being frustrated (myself included) and partly, just being obsessive. Luckily, the ‘failure’ served as a funny sort of re-whipping-into-shape.
During the first attempt, I found myself getting more into the ruler than the pencil. So in my second attempt, I tried to express that idea much more simply, along with implementing a couple simple loops/conditionals that punish the person executing the instructions for giving negative feedback about their user experience [as a computer].
So while my second attempt was under-parameterized, but perhaps more accessible/’interesting,’ my first attempt ended up failing in a very different way, in that it was too time consuming for the human “computers,” highly parameterized, and pretty devoid of interest. But aside from that, writing pseudocode for human computers was just really fun to do.
So I thought I’d share both attempts, if only to show what not to do (at least if you don’t have a reason to).

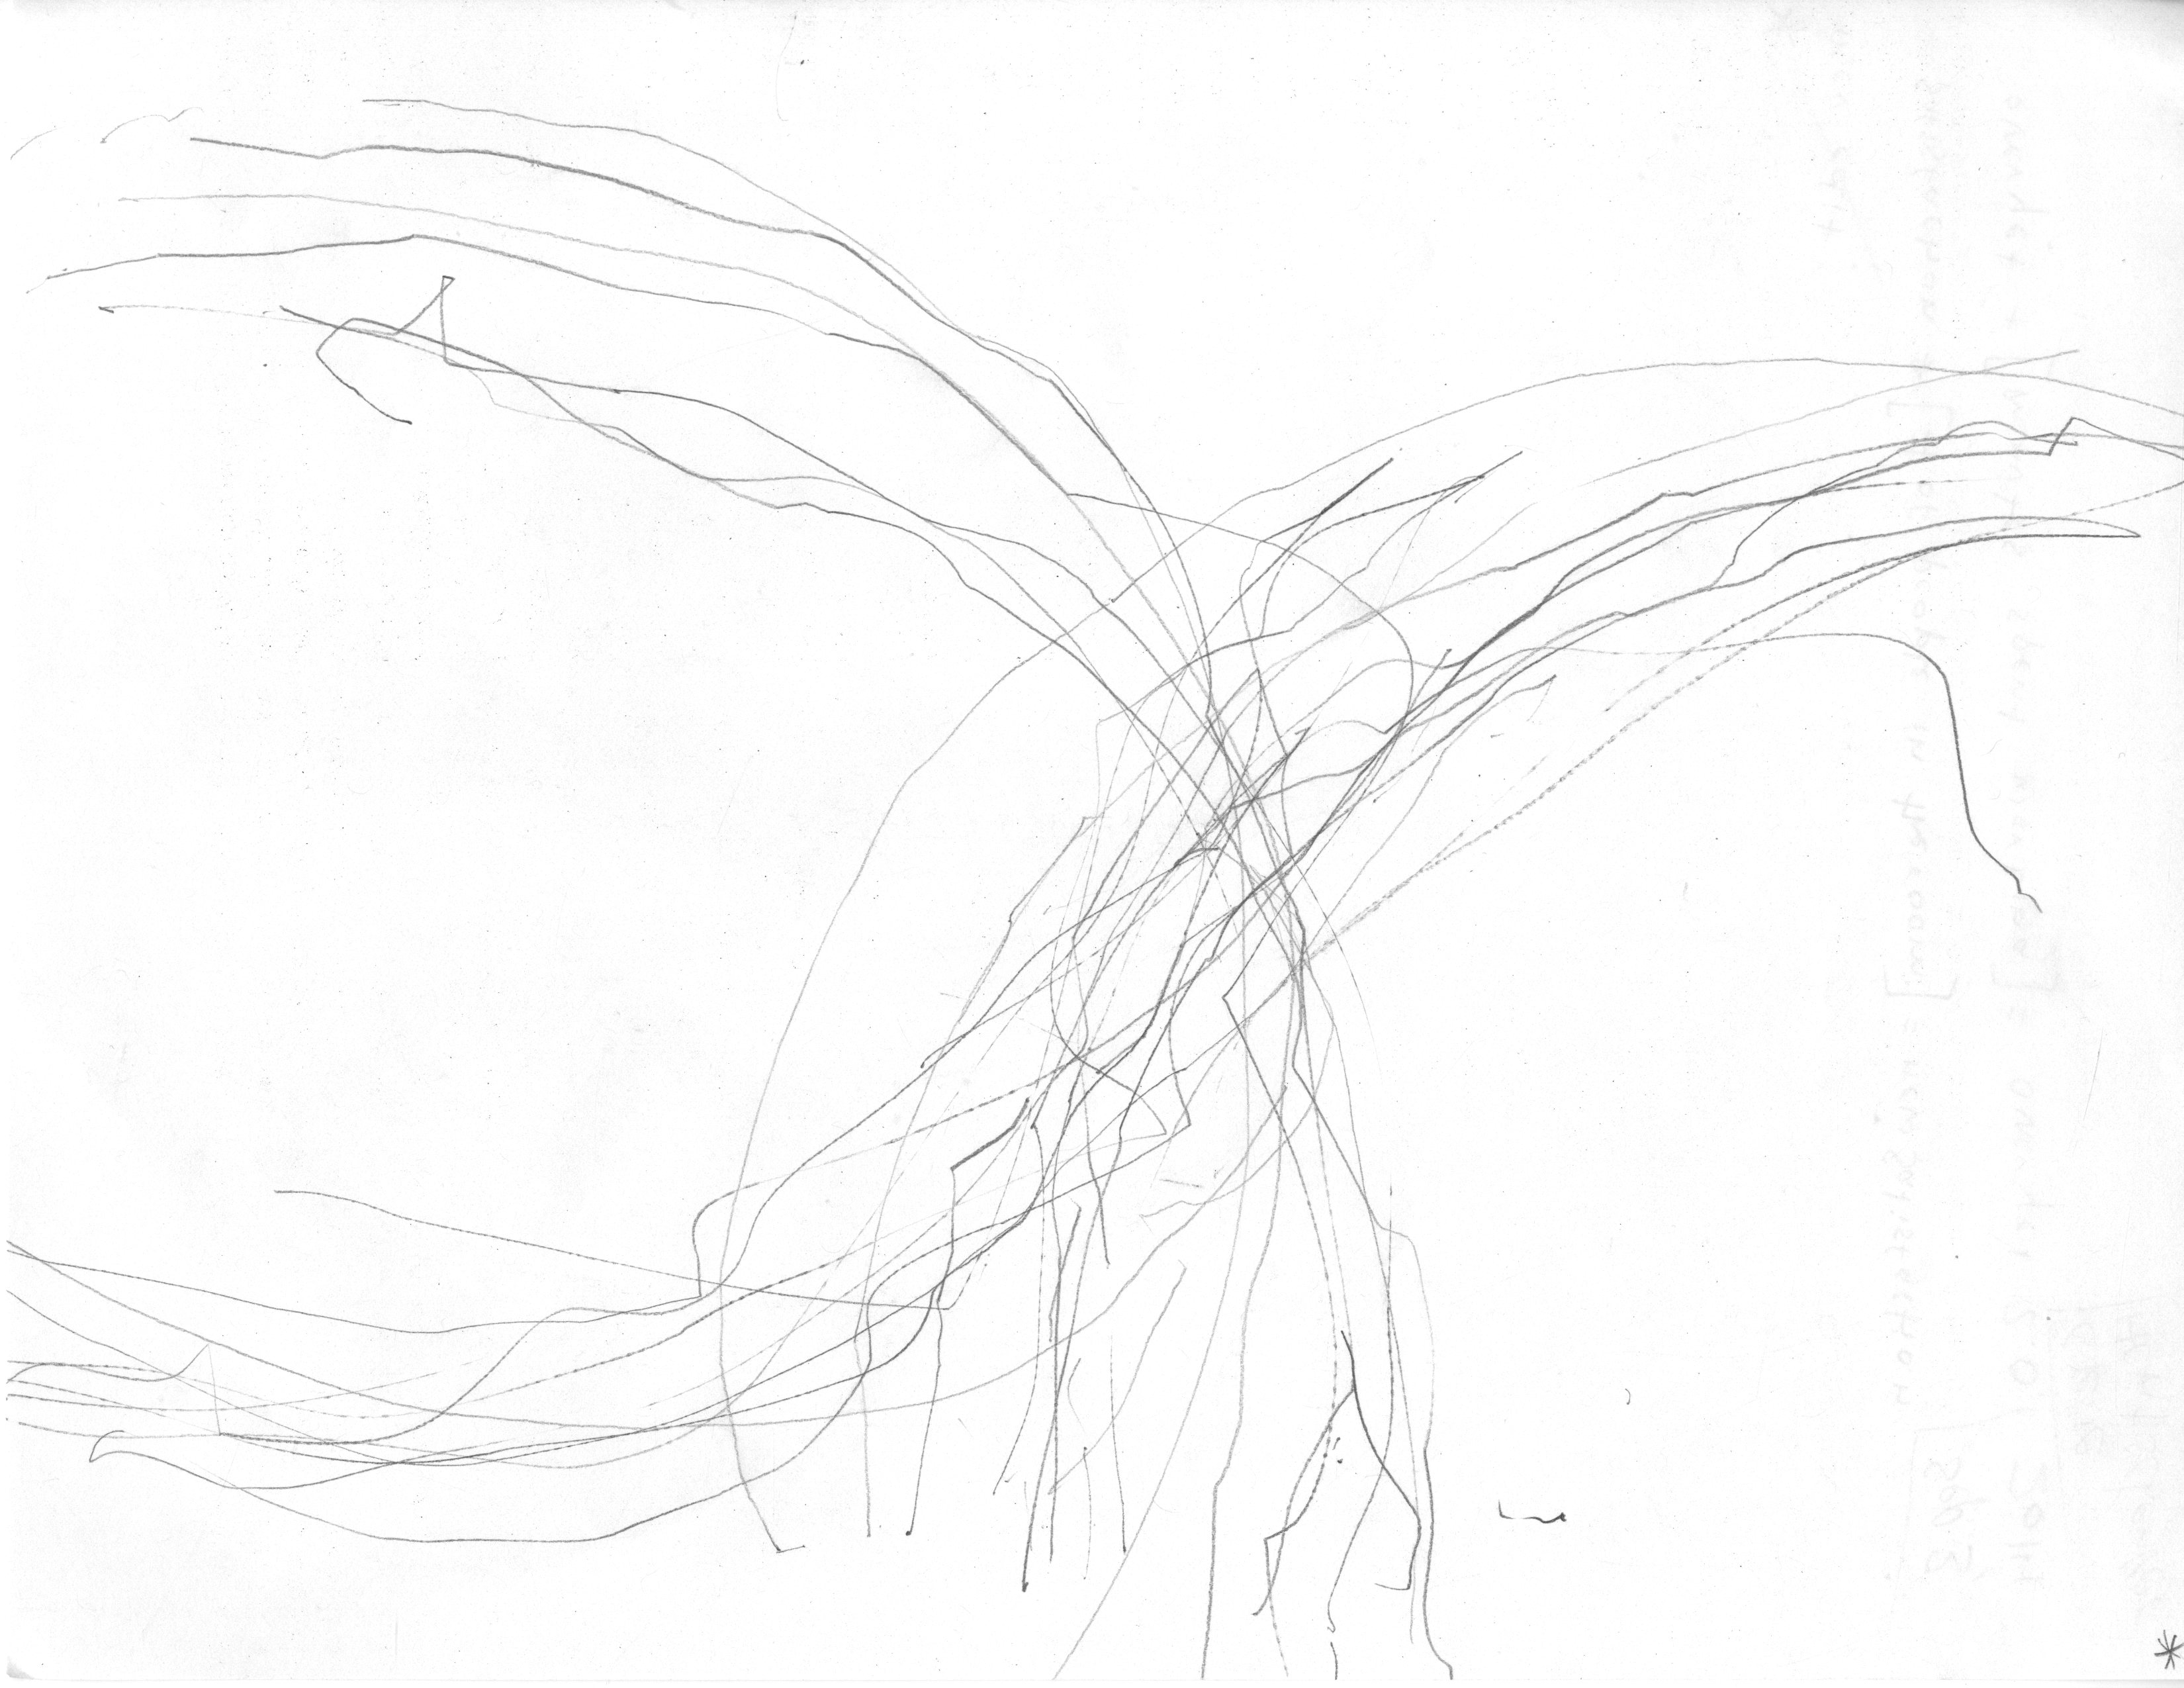

Second Attempt at Instructional Drawing (the one I actually got people to execute):
m0:
All instructions contained within functions labeled m(z) pertain to all subsequent functions labeled d(x) and n(y).
m2:
For all functions labeled d(x), use only your dominant hand.
m3:
For all functions labeled n(y), use only your non-dominant hand.
m4:
Simply execute each of the following functions in the numerical order listed below, satisfy its conditions, and then then move on to the next function, unless it is otherwise specified by a preceding function or unless x=y, then perform functions d(x) and n(y) simultaneously.
n0:
Hold your pencil in your dominant hand and ruler in your non-dominant hand. Place the paper directly in front of you on the table in portrait orientation.
d1:
Sit in a rolling chair facing a desk with the chair’s height adjusted to be just low enough to fit your knees underneath the desk but no lower.
n2:
Place the ruler on the paper such that its centimeter edge touches both the upper right hand corner and lower left hand corner of the paper.
d3:
Touch the index finger of your hand to the centimeter edge of the ruler at its 2 inch mark. Raise your finger a centimeter above the ruler’s surface.
d4:
Imagine a straight line orthogonal to the cm edge of the ruler (so, parallel to the unit notches) crossing over the 2 inch mark on the ruler.
n5:
Actually trace this imaginary line with your ‘finger’ — move it forward in space right over the ruler’s surface, and then rest it on the ruler’s surface at the midpoint of the imaginary line from function d4.
d5:
Hey! Your ‘finger’ should still line up with the 2 inch mark on the ‘ruler.’ If counting variable [n5b-count] is even, proceed to function n5b, else skip forward to function n6.
n5b:
Turn the paper and ruler 90′ clockwise. Repeat function n5, but replace the word ‘finger’ with ‘pencil’ or vice versa if it was already ‘pencil’. Add 1 to counting variable [n5b-count].
n6:
Apply just enough, but not too much pressure downwards at the 2 inch mark on the ruler to allow you to swivel the other end of the ruler around with your hand.
d7:
Don’t move at all, but imagine swiveling the ruler with one hand while holding it down with the other without disturbing the paper underneath at all.
n8:
Swivel the ruler lightly in a clockwise direction. Proceed to the next function, but don’t stop swiveling.
d9:
Hold the pencil upright with its tip at the midpoint of the long centimeter edge of the ruler. Let the pencil be pushed and guided by the swiveling ruler, generating lines and arcs on the paper.
n9:
Begin to bounce in your chair, while still using your pencil and ruler on the paper to make marks. Increase bounce frequency by a factor of 2 every 10 seconds. If [line-segs] > 1, stop bouncing after (20 + [line-segs]) seconds, else stop bouncing after 20 seconds and skip to m5.
m5:
Count the number of intersections made by the lines you have drawn on the page. Update the value of [line-segs] to this number.
m6:
Please rate the quality of this user experience with a value from 1-9 with 9 being the highest posible rating.
Store this number in the variable [value]
set the variable [satisfation] = [value]
set the value of [satisfaction = x
set the counter variable [overyet?] = [overyet? + 1]
if [overyet?] > 5 AND [satisfaction] >= 10
stop and quit
else
start again at the function d(x).
return pencil, return ruler
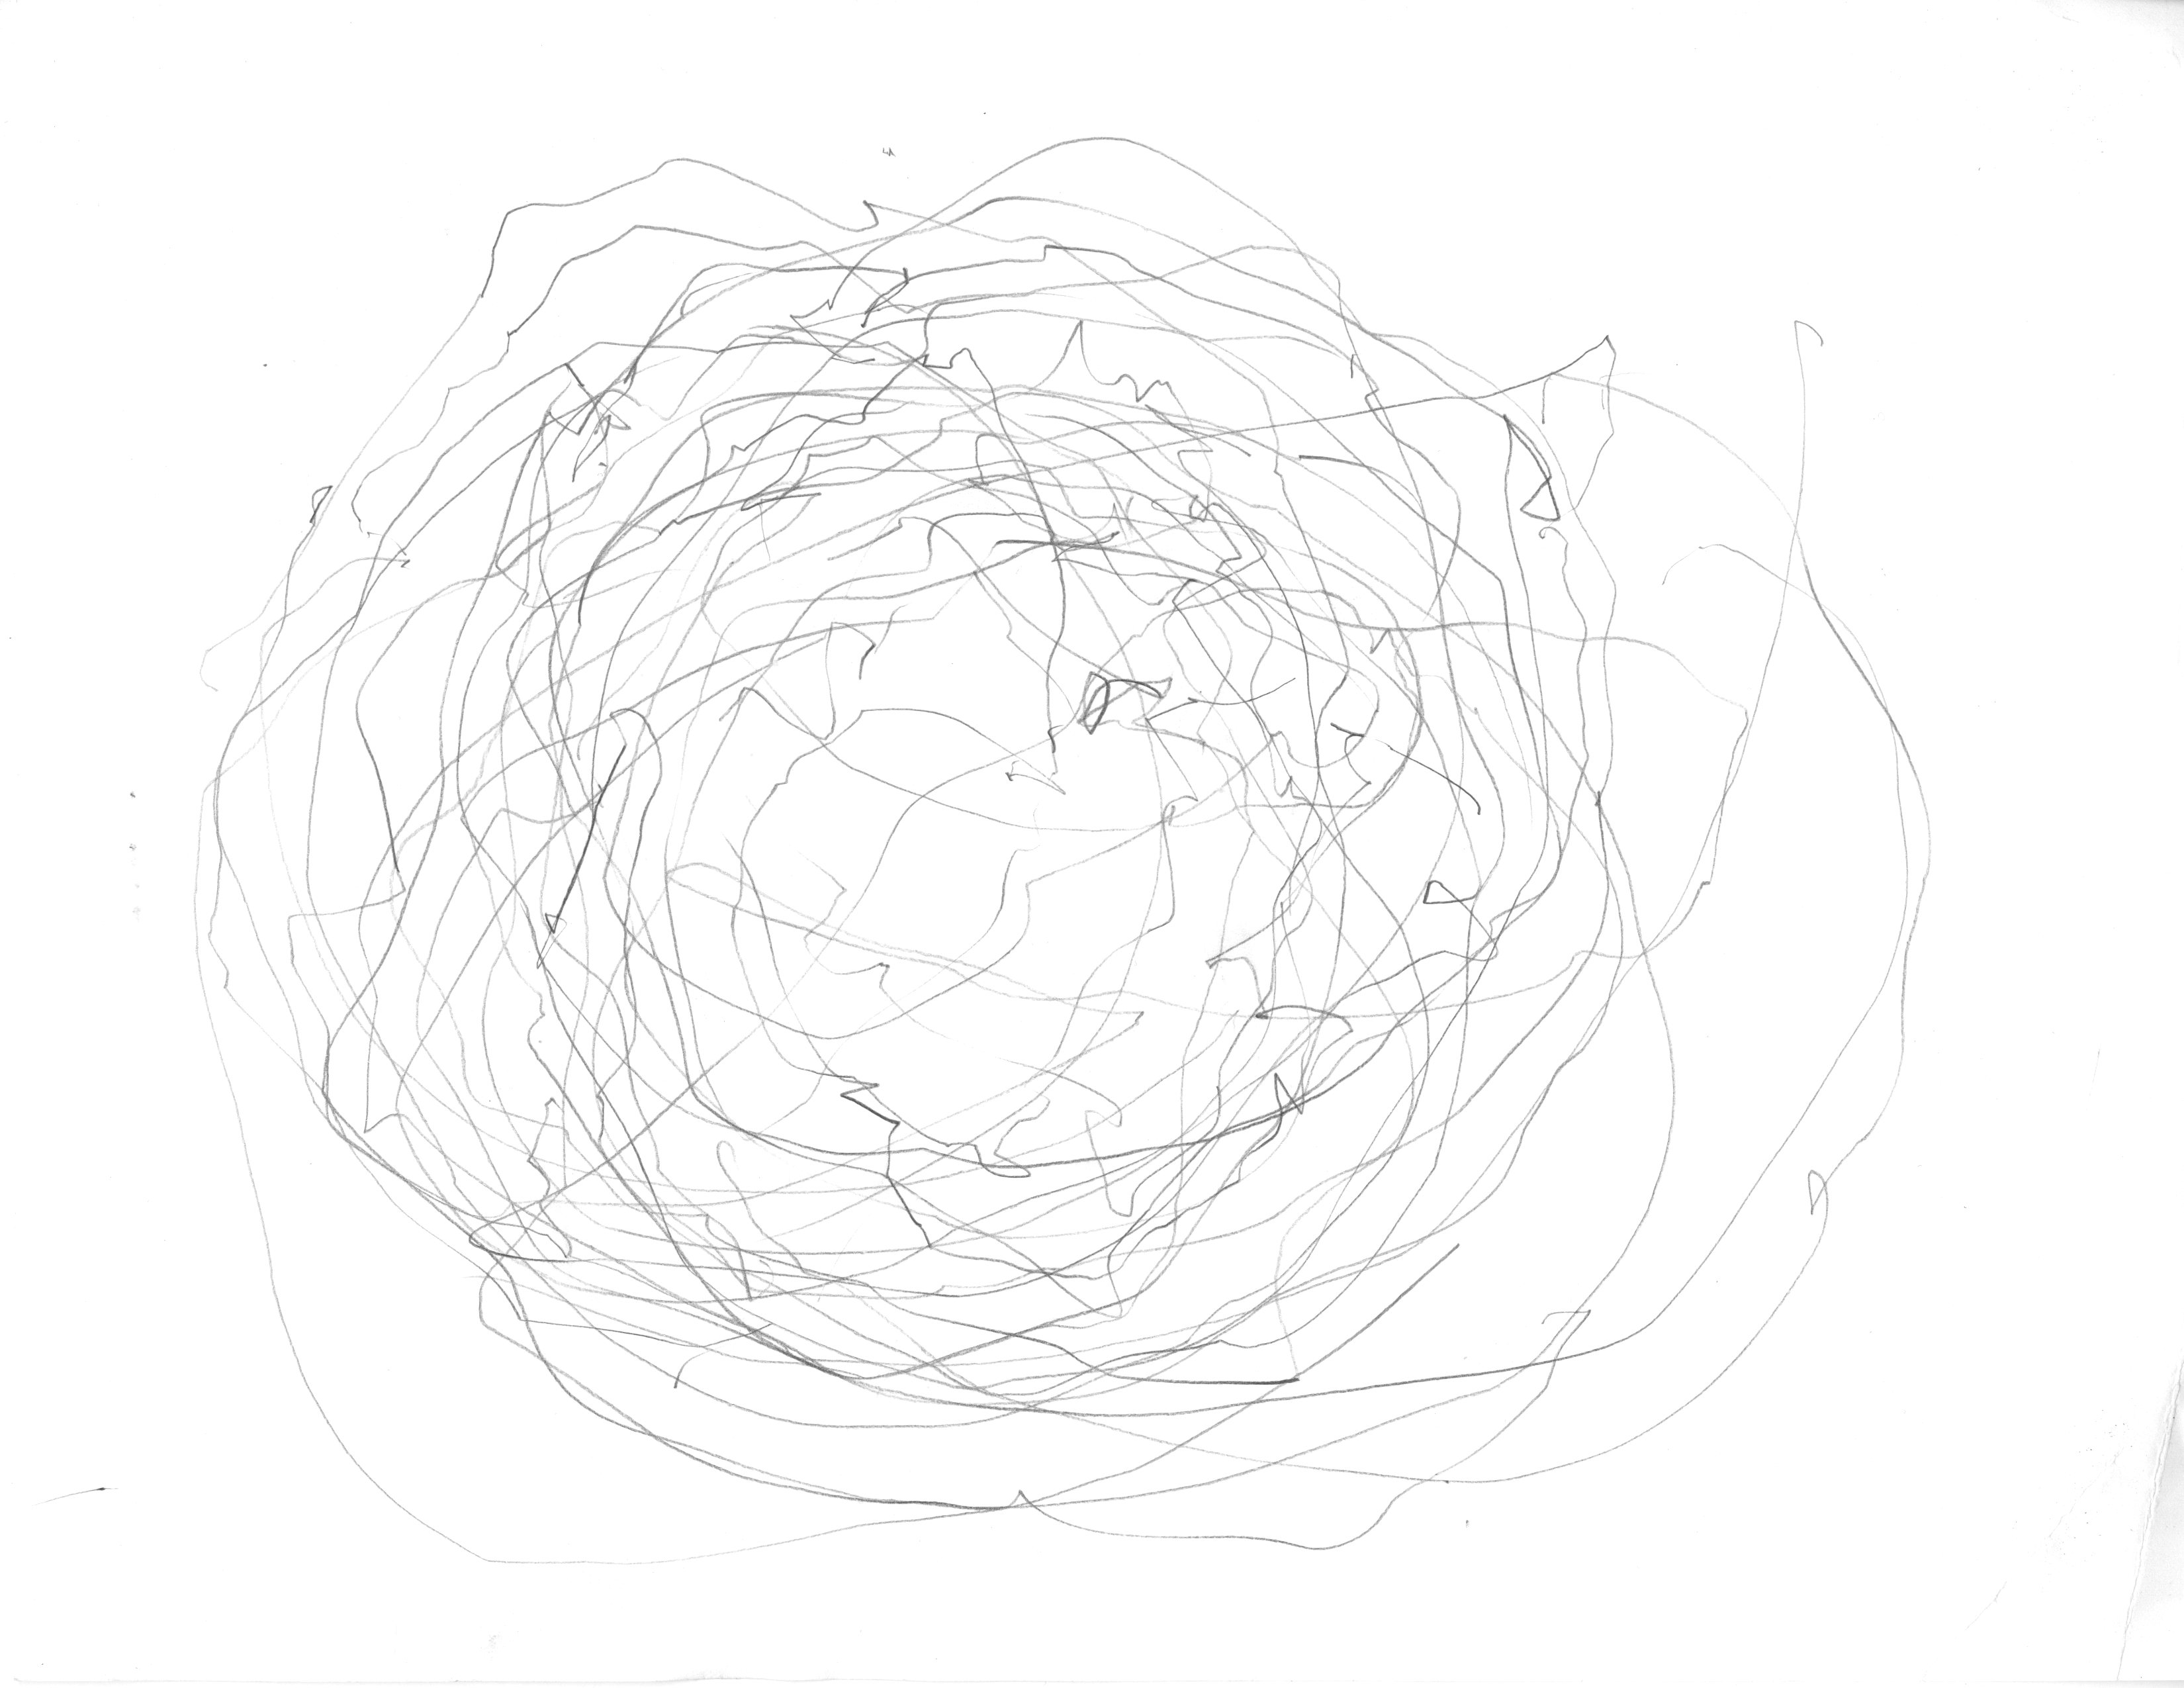
First Attempt at Instructional Drawing (plus some of the other statements I wrote trying to do this at first..)
#The subject codes like “subject1”, next to the subtask names, were just one idea that then got scrapped#
subtask0: subject1,
before you begin to do this task, sit in a rolling chair facing a desk with the chair’s height adjusted to be just low enough to fit your knees underneath the desk but no lower. Subject2, place one 8.5″ by 11″ piece of white printer paper directly in front of Subject 1 on the desk with the bottom edge of paper flush with the edge of the desk facing Subject1 and also with the midpoint of the line formed by the paper’s bottom edge aligned exactly at the midpoint of Subject1’s torso. Place a ruler and pencil on the table three inches to the right of the paper.
subtask1a: subject1,
pick up the pencil with your dominant hand or either hand if you’re ambidextrous. On the bottom edge of the piece of paper, use the provided ruler to measure out the midpoint of the line formed by the bottom-left corner and bottom right corner of the paper, and very faintly mark this midpoint with an approx. 2 mm. long vertical tick mark. Next, align the ruler so as to make a straight line bisecting the sheet of paper in half vertically through the midpoint you just measured. Using the ruler as a guide, very faintly draw a straight vertical line rising from the bottom of the page to the top. Put the ruler back where it was originally — to the right side of your desk.
subtask1b: subject1,
Grasp your pencil again. Prepare to sign your signature according to the following instructions. Make sure to center your signature at the midpoint of the bottom edge of the paper, such that the faint vertical line you drew also bisects your signature neatly. Use the bottom edge of the paper as a line for you to form your script/letters upon, like you were writing on college-ruled lined paper. After signing, remove your pencil from the paper. Get the ruler again. Measure the height of your signature and divide by two in order to find the midpoint between its highest and lowest points. Make small, faint, horizontal tick marks at both points as guides for the measurement. Then line up the the notched edge of the ruler directly on this horizontal line that bisects your signature, othogonal to the first line. Use your ruler to make the following marks with your pencil: a first endpoint dot 2mm to the left of the signature and another 2mm to the right of the signature, both falling on this bisection line. Using the ruler’s edge to connect these two endpoints, draw a straight line from one to the other, bisecting your signature horizontally.
subtask2a, subject1,
##if executed carefully correctly, subtask2 and subtask3 and subtask4 will analyze and visualize a subset of points that forms part (all the intersections) of the curving line of your signature by evaluating the spatial properties of these points using logical criteria.##
In order to pick an initial point on the curve for evaluation, first compare the height of the highest points on the curve on either half of your bisected signature. In whichever half has the highest point overall, find the lowest and rightmost point of intersection on that half of the curve that is still above the horizontal axis bisecting the signature from subtask1. If the lowest and rightmost point of intersection has not already been filled in, this will be the point you will evaluate as you now proceed to subtask2b.
subtask2a-mini-1, subject1,
[lohi-count] is a counting variable for the number of times that any newly visualized point that you have filled in / marked falls inbetween any two others, but only along the x-axis. To determine the first component of the output of subtask2b — the relational x-axis coordinates defined by the variable [lohi-choice] — which can be either valued as [highest] or [lowest], return [lohi-choice] = [lowest] if [lohi-count] is even, and return [lohi-choice] = [highest] if [lohi-count] is odd.
subtask2a-mini-2, subject1,
[lr-count] is a counting variable for the number of times that any newly visualized point that you have filled in / marked falls inbetween any two others, but only on the y-axis. To determine the second component of the output of subtask2b — the relational y-axis coordinates defined by the variable [lr-choice] — which can be either valued as [leftmost] or [rightmost], return [lr-choice] = [rightmost] if [lr-count] is even, and return [lr-choice] = [leftmost] if [lr-count] is odd.
subtask2b, subject1,
If the lowest and rightmost point has already been filled in, to determine the next point to evaluate, call subtask2a-mini-1 which outputs into [lohi-choice], and then call subtask2a-mini-2 which outputs into [lr-choice], whose respective values replace the contents of the array [lohi-choice, lr-choice]. Proceed to subtask2c. Else, proceed to subtask4. ##The array [lohi-choice, lr-choice] encodes four possible relational spatial codes: [highest, rightmost], [highest, leftmost], [lowest, leftmost], and [lowest, rightmost].
##Subject1 should interpret the values in [lohi-choice, lr-choice] as a command to find the lowest OR highest AND leftmost OR rightmost point of intersection on their signature curve, which will be further evaluated in subtask3 and subtask4 and potentially filled in during subtask4.##
Proceed to subtask2c.
subtask2c, subject1
If you have already filled in the point defined by the current values of [lohi-choice, lr-choice] generated by subtask2b, then choose the nearest point of intersection to your assigned one, but in the opposite direction of the vector defined by [lohi-choice, lr-choice], else call subtask4 [#notsure#]. If the point defined by the previous (one iteration before the current) values of [lohi-choice, lr-choice] generated by subtask2b is a point of intersection between the curve of the signature and either one or both of the two perpendicular lines that bisect it, then temporarily switch (until your current point coordinates fall on these axes again, then switch back) to choosing the furthest point of intersection from your assigned one rather than the nearest one, and in the same direction as the vector described by [lohi-choice, lr-choice]: this output will be interpreted as the new point that you will re-evaluate in subtask3. Proceed to subtask3.
subtask3, subject1,
Visually find the point of interest indexed by the relational coordinate values from subtask2. In evaluating this point using the following set of logical conditions, make sure to FIRST identify the correct truth values — [True] or [False] — and SECOND decide on the corresponding action based on the combination of *ALL* the relevant logical conditions: (1) that you have already filled in this point on the curve; (2) that this point is either the highest or lowest point on the curve whose location is the furthest to either the left or right. If both conditions (1) and (2) are satisfied, stop and procede to the next subtask. If the point on the curve being evaluated does not meet condition (1), but meets condition (2), then run subtask4. Or if the point being evaluated meets condition (1), but not (2), then run subtask2b. Else, run subtask2b.
##A single iteration of this subtask outputs one point’s spatial position on the curve and generates a physical index of it. However, you will test a number of points to see in what order they optimally fulfil a simple set of logical conditions. As you iterate this subtask more, it visualizes in higher resolution the differences in *how well* specific points along the curve meet the set of logical conditions above, and discretizes the ‘raw’ data of the hand-drawn curve.##
subtask4: Mark this point on the curve as accurately as possible with a single dot with the tip of your pencil. If you have evaluated every point on the line above the azimuth/horizontal axis of the signature’s curve or if there is not enough room physically on the line to draw any more points, then stop and procede to the next subtask. If not, run subtask2b.