Category Archives: 32-visualization

LValley

03 Mar 2015

Short:

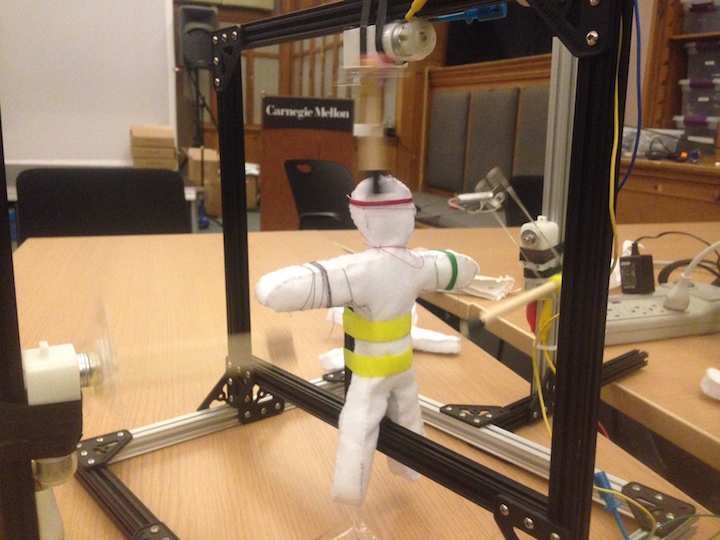
I made a visual sound doll wrapper.

Long:

I’m a fan of voodoo. (When I was five, I found a voodoo doll in New Orleans, and my parents didn’t tell me why it had a needle sticking out of its heart.)

I like the idea of a person’s body being composed of both tangible and intangible elements, so this sound visualizer was a straight forward way of doing so.

Sounds are first taken in and are then output through speed on one of three spinning wheels.

One speeds up and slows down as volume increases.

The second changes pace based on pitch.

The last switches from stopping to full speed based on a threshold of whether or not a piece of audio is “loud.”

photoThis was created using Maxuino in Max.


Notes:

Thank you Ali Momeni for the technical support and the pulled pork (it changed me).

Amy Friedman

03 Mar 2015


Tweetable: “How does the wearable technology market split up by sensor?”

I began with hand coding the data from Vandico Inc Wearable Tech Insight Database. For my thesis I am trying to figure out what I want to focus upon, and utilizing this data is a manner for me to figure out part of the space in the current market. On the Vandico website I wast able to manipulate the data and see how it interacted with one another. I utilized hierarchical agglomerative clustering to determine distance of similarity between the different wearables based on the sensors in common. I used tutorials from here and here, to help me manipulate the data. I tried to create a co-occurence matrix but found myself stuck with information I was unsure of how to overlap outside of python and utilize it in d3.js. I learned that the data clustered differently than I imagined it to. I didnt expect it to have the amount of space it did in the accelerometer section and was surprised that it appears in only 60% of the wearables, when I imagined it to be more.

I created the heatmap below to show the matrix of sensors to wearables.Screen Shot 2015-03-03 at 3.44.39 AM

I then clustered the data based on linkage and simulated its similarities in the heat map matrix chart below.Screen Shot 2015-03-03 at 3.51.09 AM

I also created a dendogram of the current market to understand how the market is clustered together based on which sensor. Screen Shot 2015-03-03 at 3.07.17 AM


I want to make this visualization multi-variant as the the experience, and plan to still accomplish this but had trouble with using the data to compare itself into a co-occurence matrix. I would also like to create a chart that is similar to this one, and show how different sensors divide to incorporate other sensors in the market. I think that one chart of clustering doesnt do the information justice and there is more to be garnered and explored, I just got caught and stuck on trying to solve one problem rather than exploring other options.

John Mars

03 Mar 2015

Exploring the CAT dataset with a human face.

DISCUSS

Inspiriations: PointerPointer

Motivations: Sort through a database of images, with images.

Process: 1) Find dataset. 2) Torrent gigantic dataset. 3) Explore ofxfacetracker. 4) Write and parse data within app.

Critique: The dataset is obviously very unimportant, and not many insights can be gleaned from it. Also, the way I go about determining which cat to use is incredibly inefficient.

GITHUB LINK

Matthew Kellogg – Phoneme Markov Graph

This is my secondary project for assignment 3. I have not yet started implementation.

Based on inspiration I had from making my bot, I decided that I would make a dynamic tree graph that would allow the user to view the possible syllables/phonemes follow a chain of phonemes based on the CMU pronouncing dictionary. I would build a Markov model of the phonemes based on the dictionary and then size the nodes in the tree respectively. This will allow the user to navigate the language in a new way and possibly generate new words. I could also choose to make the number of phonemes a factor in choosing the next syllable, unlike Markov models which are meant to reach an equilibrium (no memory other than current state). I could then add other languages in order to allow the user to compare differences in how languages sound and are patterned.

In order to implement this I plan to start with the d3.layout.tree as can be seen in an example here. From there I will add a display that shows the currently selected chain of phonemes. When a phoneme is selected the next set will be displayed and the already traversed trees will move left to focus on the current choice. If other languages are added, I will add toggles for each language, and overlay different colored circles on each phoneme node to indicate probability per language.

I feel this idea has promise, and I look forward to working on it, but have not yet made it, so there is little to critique.

Zach Rispoli

03 Mar 2015

Memory Gallery is a virtual reality gallery space that exhibits images from your browser cache. Every time the program is run, a new gallery structure is created and filled with your cache.

gallerygif1

As the user walks through the gallery, artworks start to disappear and your browser’s cache is slowly cleared. The gallery allows for a last glimpse before everything is erased.

Screen Shot 2015-03-03 at 7.18.10 AM

Screen Shot 2015-03-03 at 7.18.27 AM

Screen Shot 2015-03-03 at 7.19.19 AM

At some point there will be a Windows version as well as an Oculus Rift/VR version!

Check out the code on GitHub