The first project I want to introduce is called “Where We Came From and Where We Went“. As the name suggested, it visualized the data of migration from state to state.
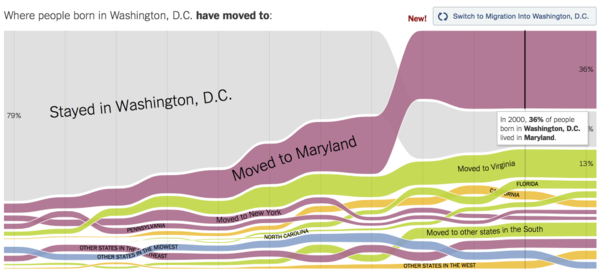
It seems people born in the capital tend to choose live in other places, such as Maryland and Virginia.
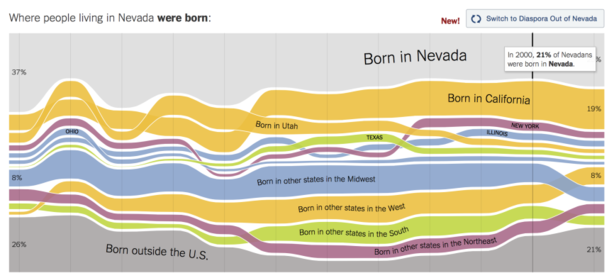
The portion of Nevada’s residents who was born in Nevada is the least in all states in the US. Most of its residents came from neighboring states.
This work is really easy for me to get information from, which I think is the most important thing to judge a data visualization project — correct me if I was wrong. It’s hard to manage a large amount of data and this work has done a great job.
There are still some points I think should be improved. The allocation of color and height is not explicitly stated. Like shown in Nevada’s chart, the color of “Born in California” and “Born in Utah” is identical. Also, I noticed the bars shown in the graphics are divided into four groups — the native, the states, the regions, and outside the U.S. It won’t come at first glance, and that’s where might make people confused about.
Similar work can be found in the New York Times’s Upshot, like this one — Mapping migration in United States. There is a large possibility that they share the same data. But this one uses graphics instead of charts to represent data.
————————————————————————————
Selfiecity is an interactive website showing data and analyzation about a research into selfies. Although I’m not a selfie person, it’s still of great interest. This project try to figure out the features and trend of selfies in five major cities in the world.
What they do to collect selfies is collecting random photos from Instagram and ask people to label if the photo a selfie or not. I think this data collecting solution is a bit trivial. There are 140,000 images they collected! Maybe it’s a better way to label selfies using some machine learning solutions. Some of the selfie analysis are interesting, like gender distribution and age distribution, but some are not. You can filter selfies using mouth open or closed option, but it is of little importance to me. Maybe it’s better to detect the background in a selfie, to figure out in what conditions people are tend to take a photo of themselves.
————————————————————————————
There are really a lot of good stuff I want to share. Here is the access to these works!
http://gizmodo.com/the-best-data-visualizations-of-2014-1674001488