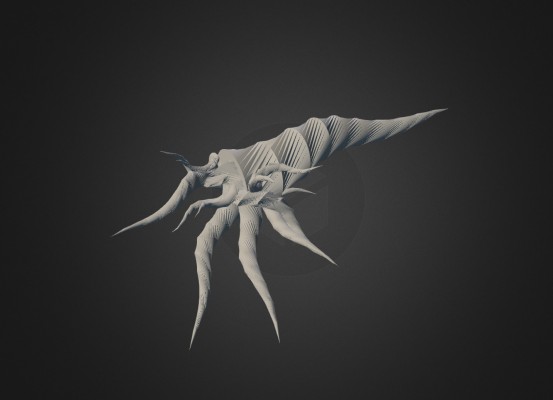
Tentacles representing passwords generated based on their user base

10 million username-password combinations were recently released. I found the 10 most popular passwords and calculated the number of users for each one. I then spread them out into 26 groups, based on the starting letters of their usernames (I threw out ones that start with symbols or numbers because they were a negligible amount of them). Then, for each of the 10 most popular passwords, I generated 26 tentacles, representing the starting letter distribution of the passwords. The lengths of the tentacles are normalized by the most frequent starting letter of the usernames of each password. In other words, the size of the tentacles are equivalent to a histogram distribution of the letters.
In every password tentacle cluster, there exists at least one massive tentacle. This is usually the letter “s”, which a disproportionate amount of usernames start with. Some other letters also stand out, such as “b” or “m”. Finally, for the password “dragon”, its most frequent username’s starting letter is actually “d”, beating out “s” as in most other passwords. I wonder why this is the case…
I originally wanted to visualize this via a bipartite graph, with edges going between clusters of usernames and passwords. However, this would generate too much clutter, so I decided to visualize each password individually. Next, I decided that 2D space is still too cluttered, and since tentacles look like graphs in 3D space, I decided to just modify my existing tentacle generation code.
The 10 most popular passwords, in order:
123456
password
12345678
qwerty
123456789
12345
1234
111111
1234567
dragon
Their visualizations:
[sketchfab id=”b23ae121b26b4ef588fb6b37a2a63edf” height=”480″ start=”0″ controls=”0″]
[sketchfab id=”09e6fa5d6d3949b58e10bbf30bcfd6ce” height=”480″ start=”0″ controls=”0″]
[sketchfab id=”af63bf1839264a718c7120de532cbe8a” height=”480″ start=”0″ controls=”0″]
[sketchfab id=”2d9b5ba689254c09a20e7daf99bcb93d” height=”480″ start=”0″ controls=”0″]
[sketchfab id=”6910767c593c4b0b99f3a548e3bba8a9″ height=”480″ start=”0″ controls=”0″]
[sketchfab id=”ba5e6a6c37ab4a029d68be71fb25c593″ height=”480″ start=”0″ controls=”0″]
[sketchfab id=”ff86e8bb79414250aa4ce79f549a4ca7″ height=”480″ start=”0″ controls=”0″]
[sketchfab id=”39145b7c8c63405b82f2fb676a98ebc0″ height=”480″ start=”0″ controls=”0″]
[sketchfab id=”378d8822236541ed9c9648dbb0f90cec” height=”480″ start=”0″ controls=”0″]
[sketchfab id=”0b1b8b094f5643a7a16885f041b55f67″ height=”480″ start=”0″ controls=”0″]