This week both projects are going to be related to the data visualization assignment.
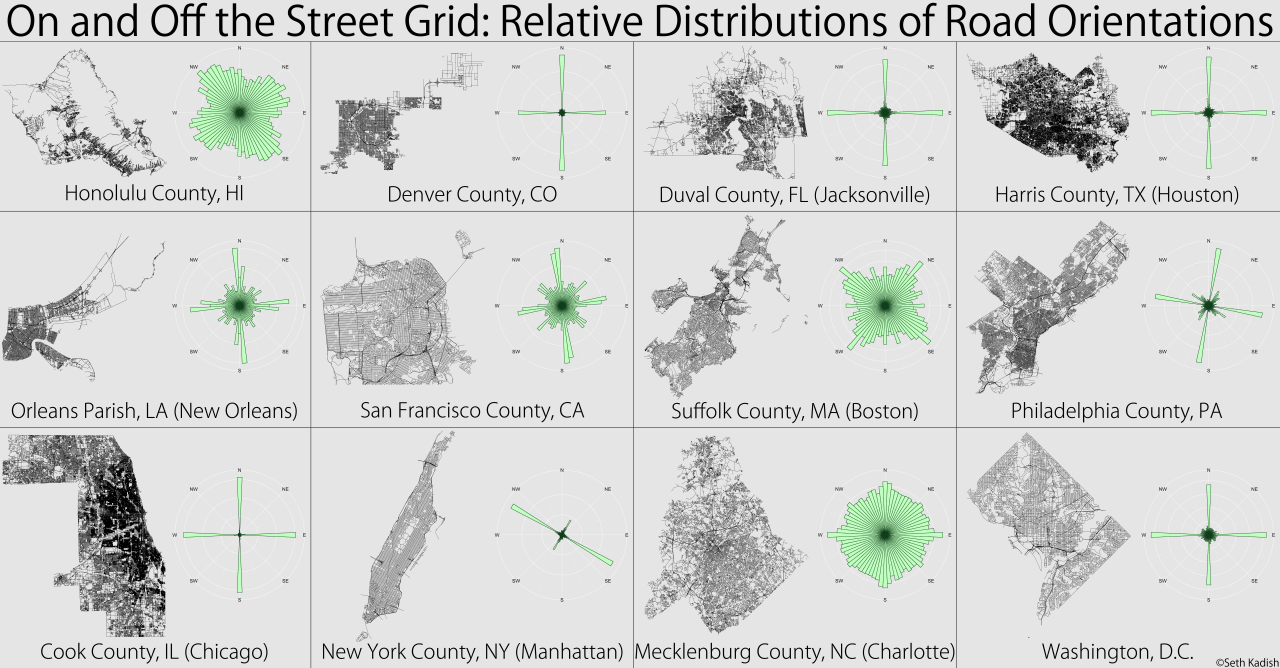
The first project is On and Off the Street Grid (Seth Kadish, 2014). The author is a data scientist an admirer of regular grids (specially when oriented towards cardinal directions) so basically It consists of the analysis and comparison of the orientation of the grid of different North American counties. After evaluating all the azimuth of the streets in the specified area he creates a diagram with their distribution using bins of 5 degrees. For me the most interesting part of this project is this diagram and its capacity to filter the complexity of a feature of a grid into a very simple representation.

berlin
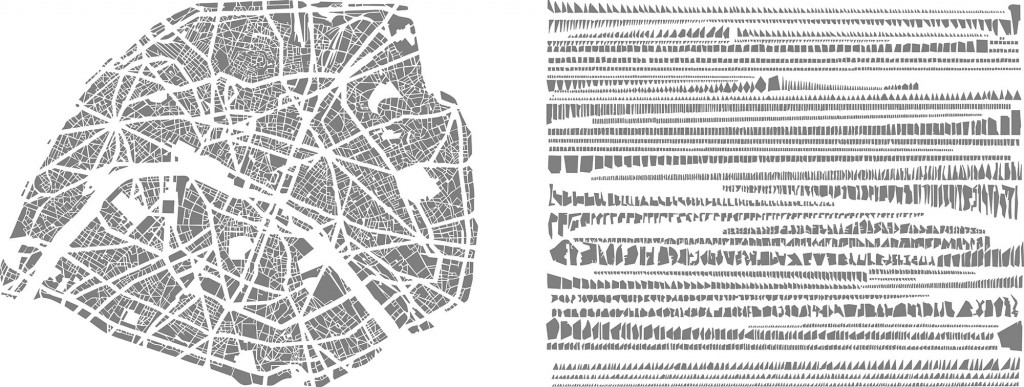
paris

new york
The second project is Anagrammes graphiques de plans de villes or Les Villes Rangees (Armelle Caron, 2005/2008). It also deals with maps, bit instead of the grid map, it considers its negative: the building blocks (or in the case of the countries, the land blocks). Firstly, building blocks are represented with only one colour, while grids, rivers or other elements are dissolved in a white background. Then, Canon deconstructs and decontextualizes the building parts with a very rigid system of classification. These parts are reorganized and clustered in a white rectangular plan similar to the original, based on their specific shapes and sizes. Their characteristics determine their position in series of rows. It is almost as if the geographic and urban maps gave place to a kit of parts, a military parade or a scientific classification. However, it is clear that the objective procedure is not used for the sake of curiosity (as in the first project) but to support an aesthetic statement: a mix of distance or even estrangement with the configuration and representation of our territory.