This project was a trail of exploration starting with a large database of Japanese woodblock prints and an interest in using code to learn about the process that made them.
The database I used was ukiyo-e.org created by the amazing John Resig. With the help of Ajayan Subramanian I was able to write some simple code to download the images from the database.
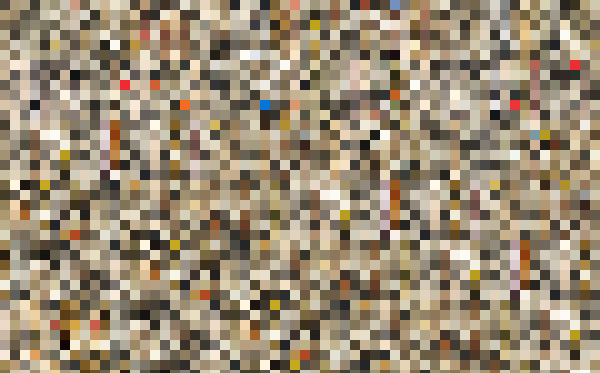
The first thing I did with these images was simply to look though them and get to know them a little. One image at a time is helpful in some ways be sometimes a larger perspective is productive. For this I turned to ofx-TSNE. Using this addon I was able to create the following image. The TSNE algorithm organizes images based on similar properties.
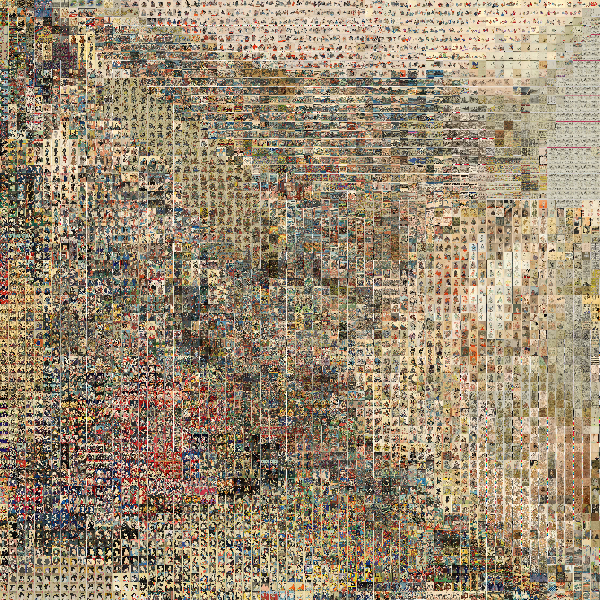
Low res version of full grid
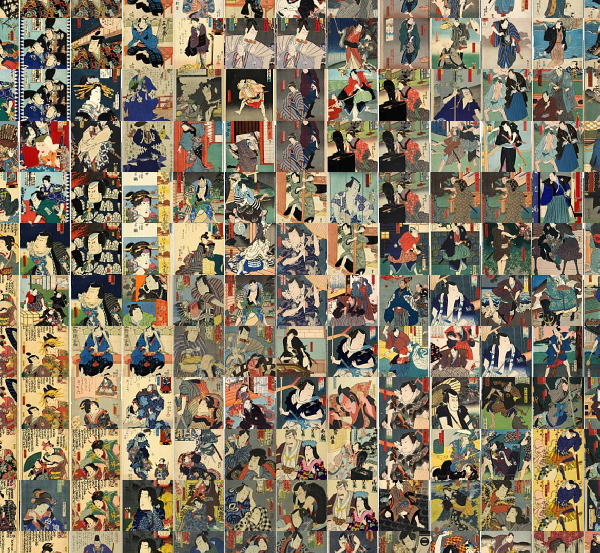
Close up of grid
I’m not an expert on traditional Japanese woodblock prints, but I’ve done a little bit a research in to how the prints are put together. Each print is made with multiple blocks one for each color. Thinking about this I thought it might be interesting to break the images up in to the component parts. I created a bunch of images like the one bellow to help me better understand the color space of these images.
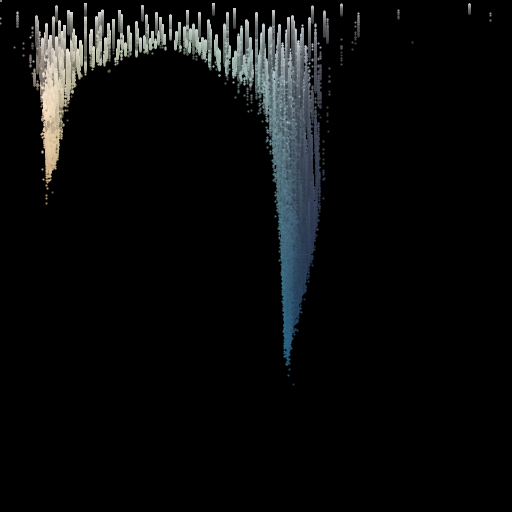
Each point is a color value found in the original print. The X position is mapped to Hue and the Y is mapped to Saturation.
Next I spent time attempting to write a K-Means clustering algorithm. Unfortunately I spent a good amount of time working on this algorithm and I’m not sure I ever got it working right or if it was the right algorithm for the job. In an attempt to sort this out I created some visualizations.
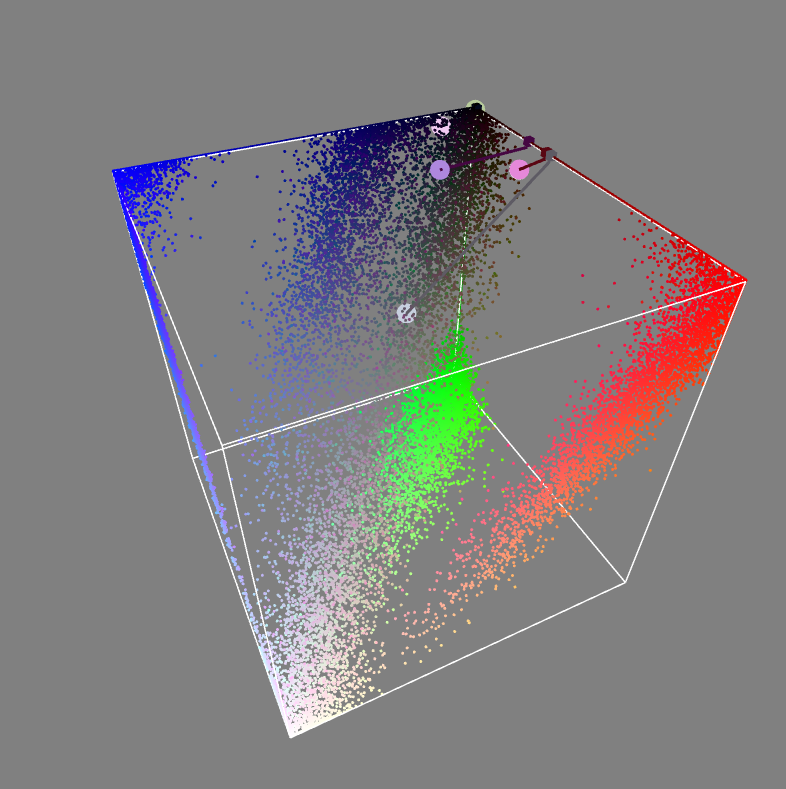
RGB mapped to XYZ space. Each large dot is where the program thinks a cluster is centered.
Eventually I gave up on writing my own K-Means and found an existing piece of code that would pull out the top colors in an image. K-Means code. From there I converted the text hex values in to small color patches and combined these patches in to an grid. I was hoping this might reveal something meaningful, but I’m not sure how successful this was.
Cropped section of full gird. gird is sorted by artists and print.
The final experiment I did was to simply remove the brightness from the images. This turned out to be surprisingly good at separating out the color blocks.
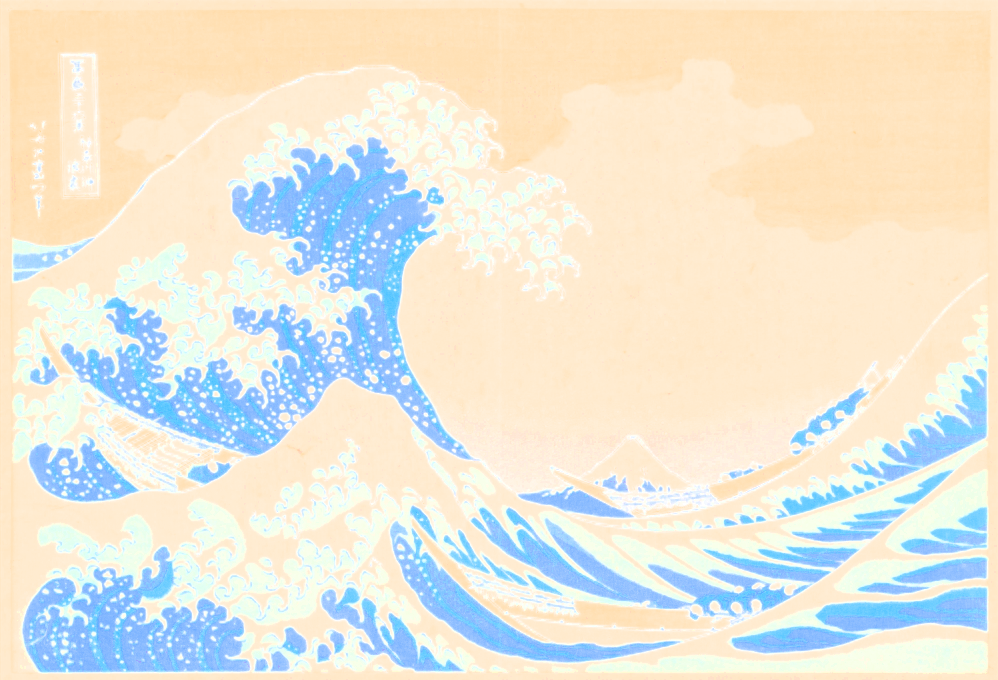
The Great Wave print with all brightness at full.
Code can be found here.