Category Archives: 01-maps

Oliver Daids

02 Feb 2016

Code: https://github.com/Oddity007/OF-Drone-Strike-Data-Viewer

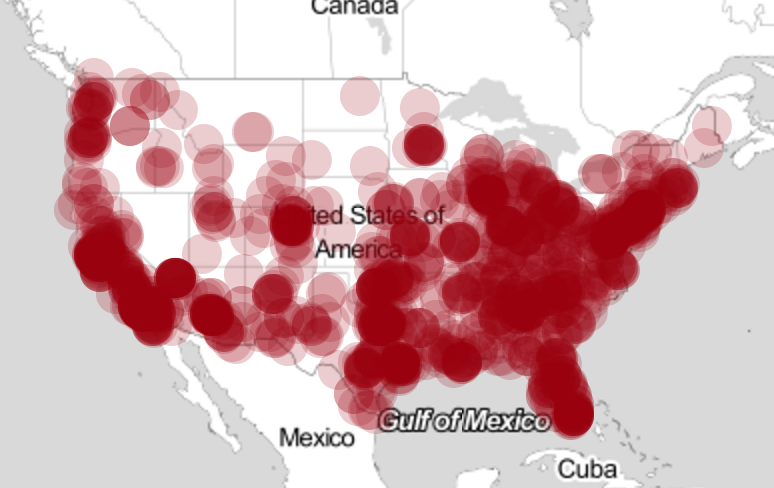
Drone strikes are things that the average U.S. resident is well removed from. For most of us, drone strikes are these things that we know about and might joke about, but have never experienced and probably never will. …

Zaria Howard

30 Jan 2016

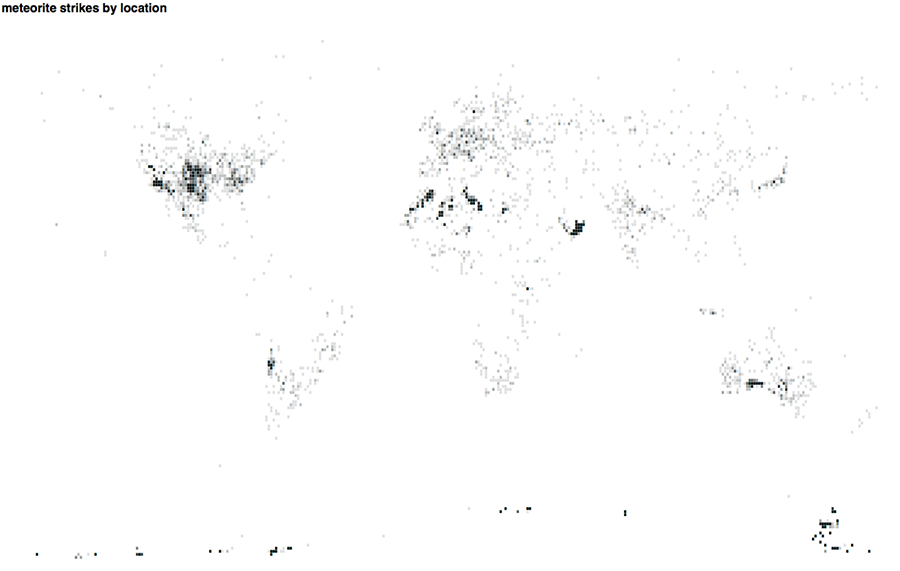
The goals of this assignment were to map drone strike data on the typical cartographic map and on a data display that wasn’t a map. Since both of these skills I had basically zero experience with I decided to aim …

Bo Kim

28 Jan 2016


I visualized all the earthquakes that happened in the past month using Leaflet. I initially thought about visualizing names of the people killed by the police or from gun deaths and compare them with the names popular in 2015. …

Ajayan-maps

I picked the gun deaths in 2013 data set. I really liked the @censusAmericans twitter bot. I intended to tell a story about the individual deaths.

For the plotting on a map, I used Leaflets, along with the latlong data …

Jessica Shen

28 Jan 2016

  1.  Plotting on a map.

I used the data from “The counted” database.  I think that the year of 2015 was when police violence became especially prevalent in social media, and wanted to explore it.

  1. Screen Shot 2016-01-28 at 3.44.24 AM
    Screen Shot 2016-01-28 at 3.44.17 AM

    For this first map, I used

Christopher Wei

27 Jan 2016

thecountedthecounted-2

For my first visualization, I used Mapbox to visualize The Counted database of people killed by police in 2015 which runs on Node.js (which was not entirely necessary until Mapbox tries to open the locally hosted csv file and …

Chelsea Kwong

27 Jan 2016

Screen Shot 2016-01-27 at 11.32.51 PMScreen Shot 2016-01-27 at 11.32.41 PM  Screen Shot 2016-01-27 at 11.33.10 PM Screen Shot 2016-01-27 at 11.33.30 PM

Screen Shot 2016-01-27 at 11.34.23 PM Screen Shot 2016-01-27 at 11.34.35 PM
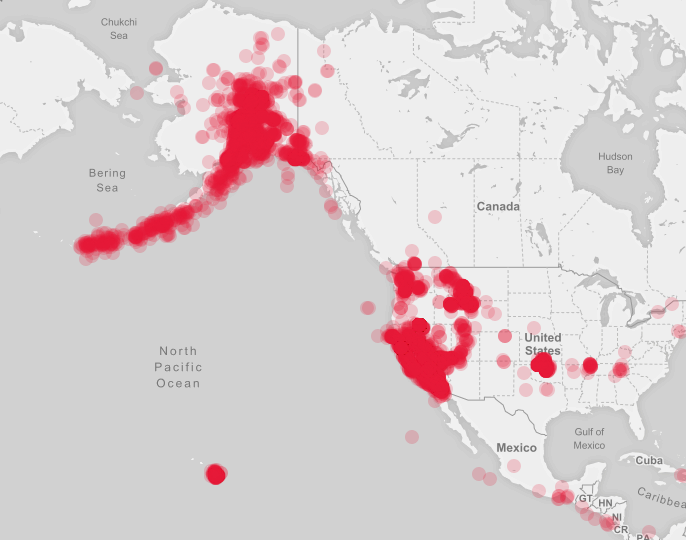
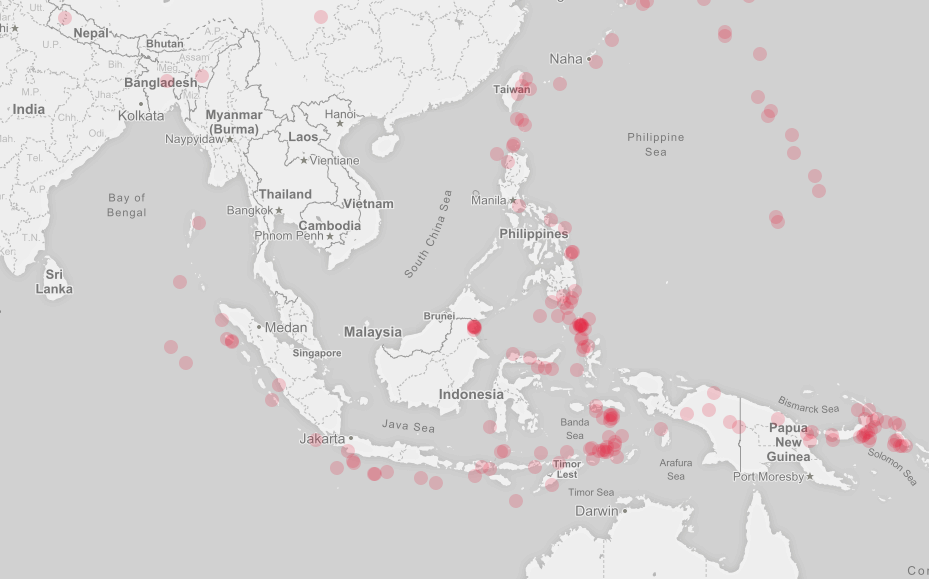
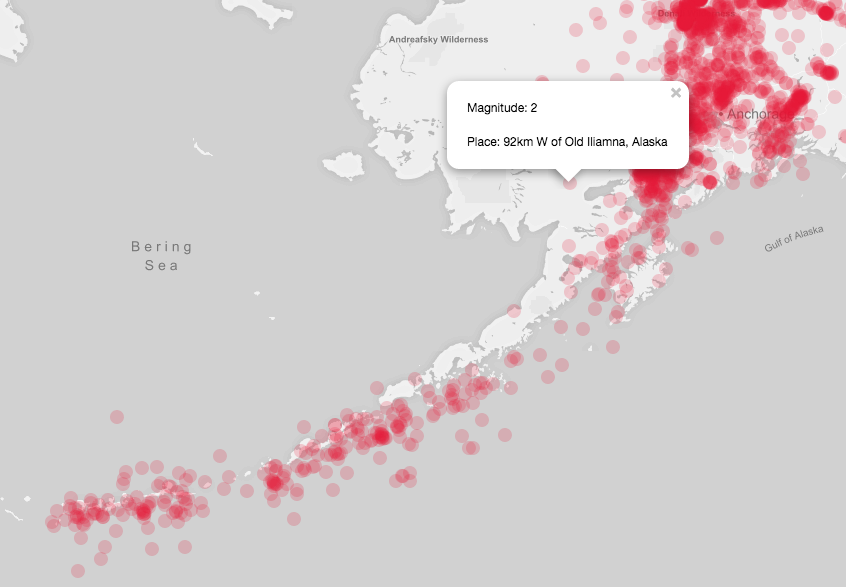
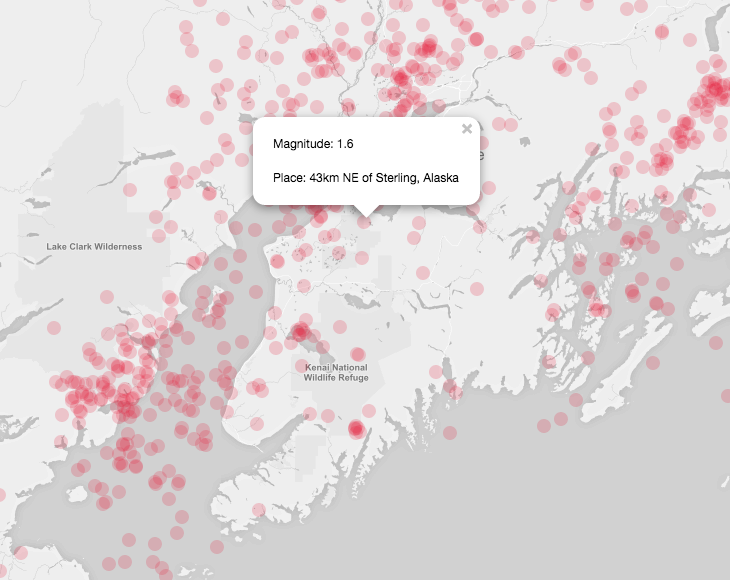
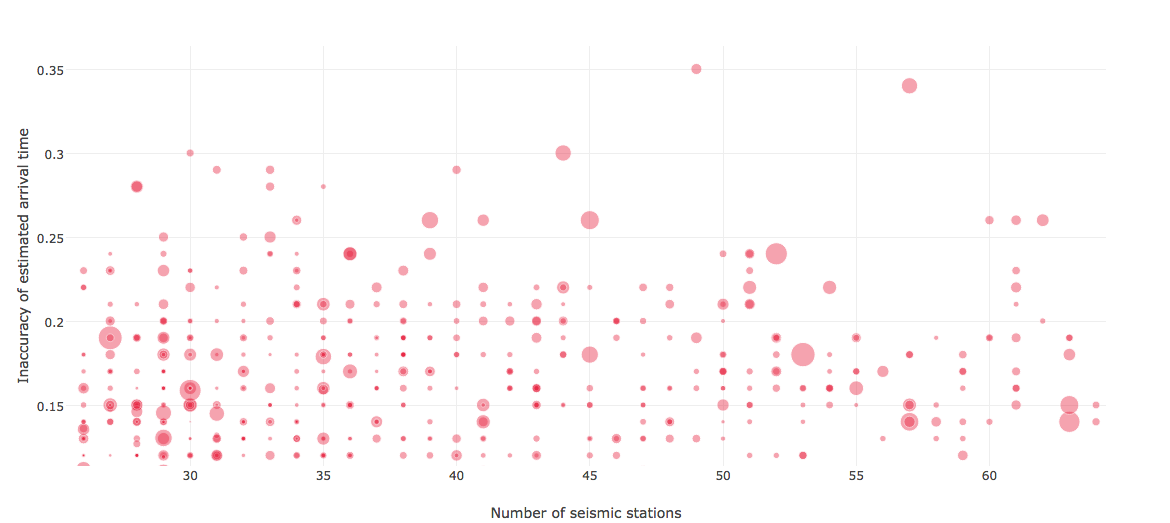
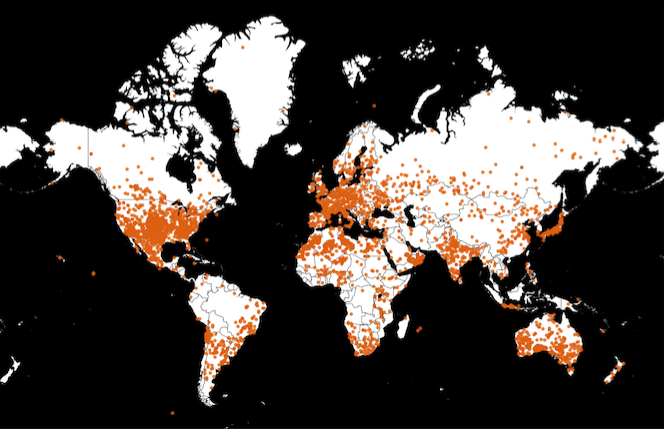
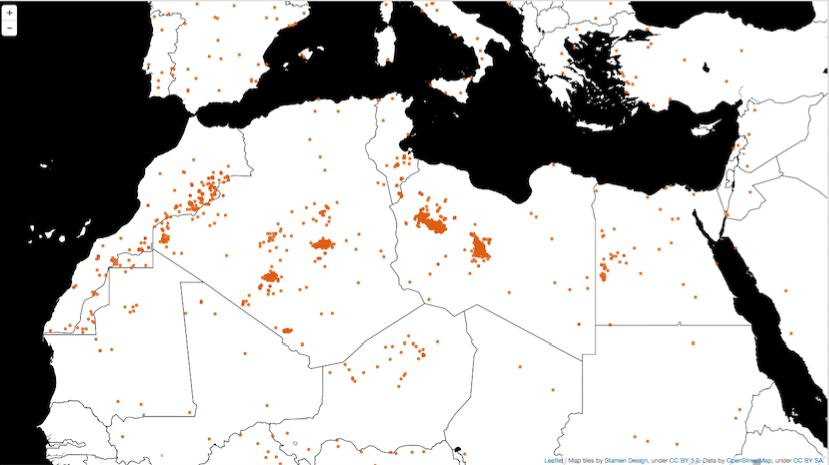
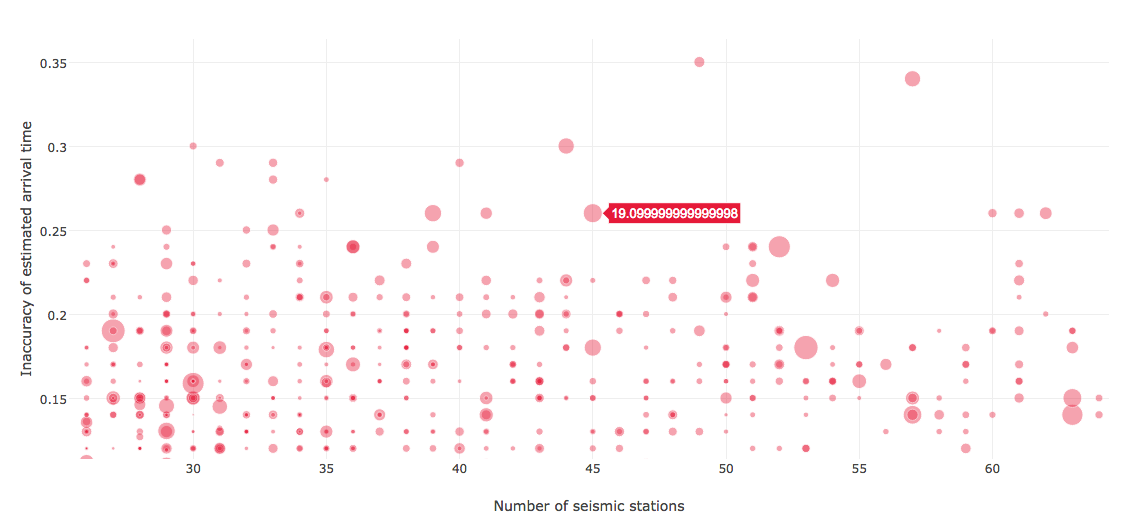
I used the earthquake data for this part of the assignment. For part 1 I simply plotted it on a geographical map; for part 2 I had 3 dimensions of measurement: number of seismic station, the earthquake prediction accuracy, and …

Katherine Habeck

27 Jan 2016

Screen Shot 2016-01-26 at 10.58.39 PMScreen Shot 2016-01-26 at 10.59.27 PM


Using Leaflet, I plotted the dataset of recorded meteor strikes. For this visualization I chose a very simple black and white, high contrast, tile from stamen, and used a bright orange circle to denote the meteor strikes. My goal …