Visualizing Andrew File System
Summary
My project for a visualization of a map involved visualizing student activity on the unix machines at Carnegie Mellon. The premise behind the project is that in unix based servers, if you are logged in you can see metadata related to what everyone else is doing on that particular machine. So I wrote a python script that collects this data in fixed 5 minute intervals.
The target machines in question are unix1 through unix6, which are located at unix#.andrew.cmu.edu. Since AFS will automatically slay long running background processes, I was forced to SSH into each of the unix machines one at a time, run the w command, and pipe the results back to my local machine. The results are then processed and stored into a database.
After collecting sufficient data, I used D3 to visualize some fun queries. Had I more time, I would have liked to collected a separate table that included metadata about each person (like gender, grade, affiliation etc) using the finger command and plotted some more intimate data.
Results
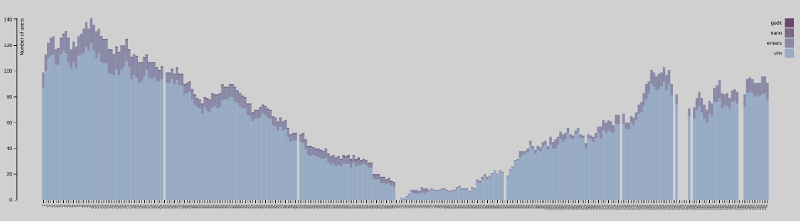
Usage of different editors over a course of a day
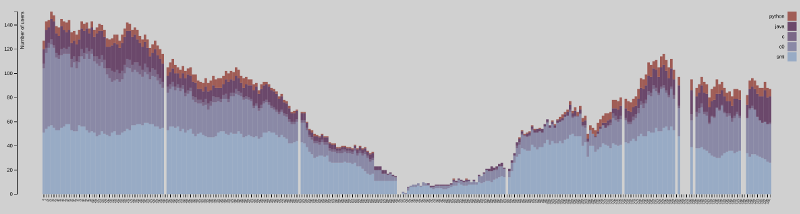
What type of files editors were editing through a course of a day
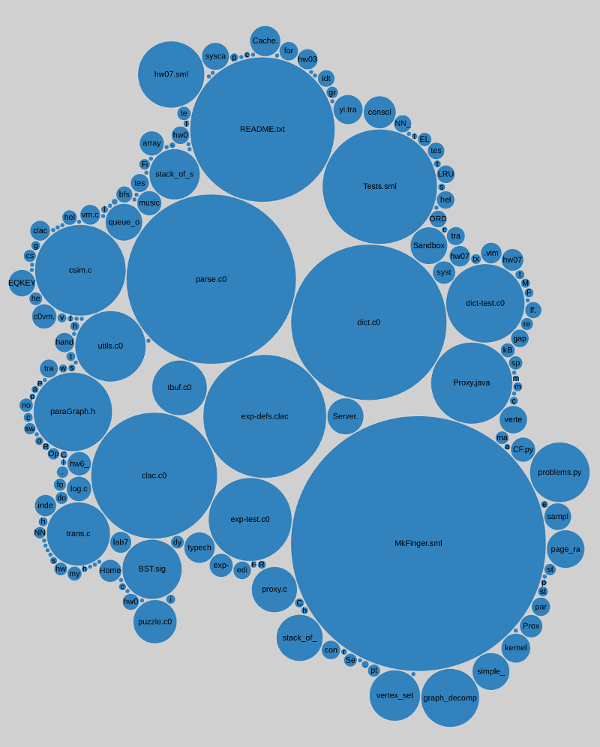
Number of minutes spent collectively on a file name over a course of a day