Nadav Hochman (University of Pittsburgh, History of Art and Architecture department)
Lev Manovich (CUNY)
Jay Chow
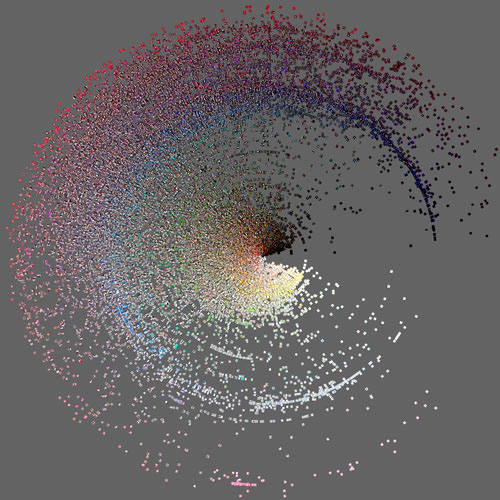
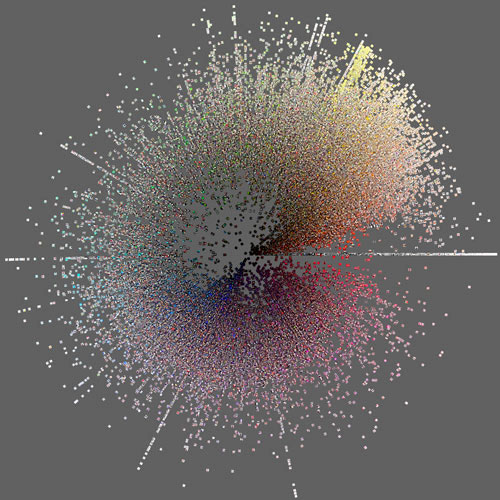
Photo trails is a digital humanities project that visualizes large sets of Instagram photos, in realtime, as an attempt to pick out visual patterns between cities. They use 2.3 million photos from 13 cities to show “how temporal changes in number of shared photos, their locations, and visual characteristics can uncover social, cultural and political insights about people’s activity around the world.” The project uses an open source software tool called ImagePlot that can visualize image collections (pretty cool and worth checking out! ). Millions of images come together to create a single image for each city, a radial smattering of colors and and tones. The Instagram photos are sorted by hue and brightness.
While the result of this image processing turns up a very beautiful and complex snowflake-like color graph, it seems problematic to reduce a city’s “cultural and political insights” to a single, static map. I’m skeptical about how significant cultural trends can really be gleaned from sorting user generated photos by color and brightness .Taking the publicly posted images of smart-phone owners within a city biases the variety of images/experiences that are present. Instagram uploaders are a very narrow population to learn about local visual rhythms.
Check out a high-res version here: