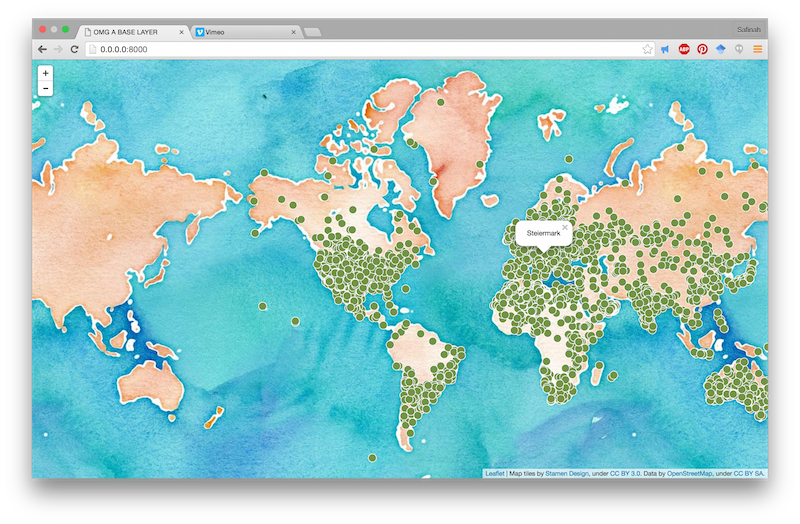
For my Map visualization, I selected the meteorite strike data. The data was especially intriguing to me, since meteorite strikes are not something we actively thing about. I wanted to portray through a visualization that it actually happens, and the impact could be major. For my first visualization I used a simple visualization of strike locations on a map. I used Leaflet-js plug-in to implement this. I especially made use of Ingrid’s workshop on map visualization. I used the watercolor map tiles by Stamen Design.
The visualizations places all the meteorite strikes at their location on the map. In addition to that, one can click on each of the points to see the place of the name of the strike.
For my second visualization, I wanted to demonstrate how there is a huge variety in the meteorites that strike the planet. I sorted the meteorites in the order of their size and made an animation that plays the increasing of the size of these meteorites while displaying the year and the description on the side. I used processing to achieve this.
Source code: https://github.com/safinahali/meteorite-map.git