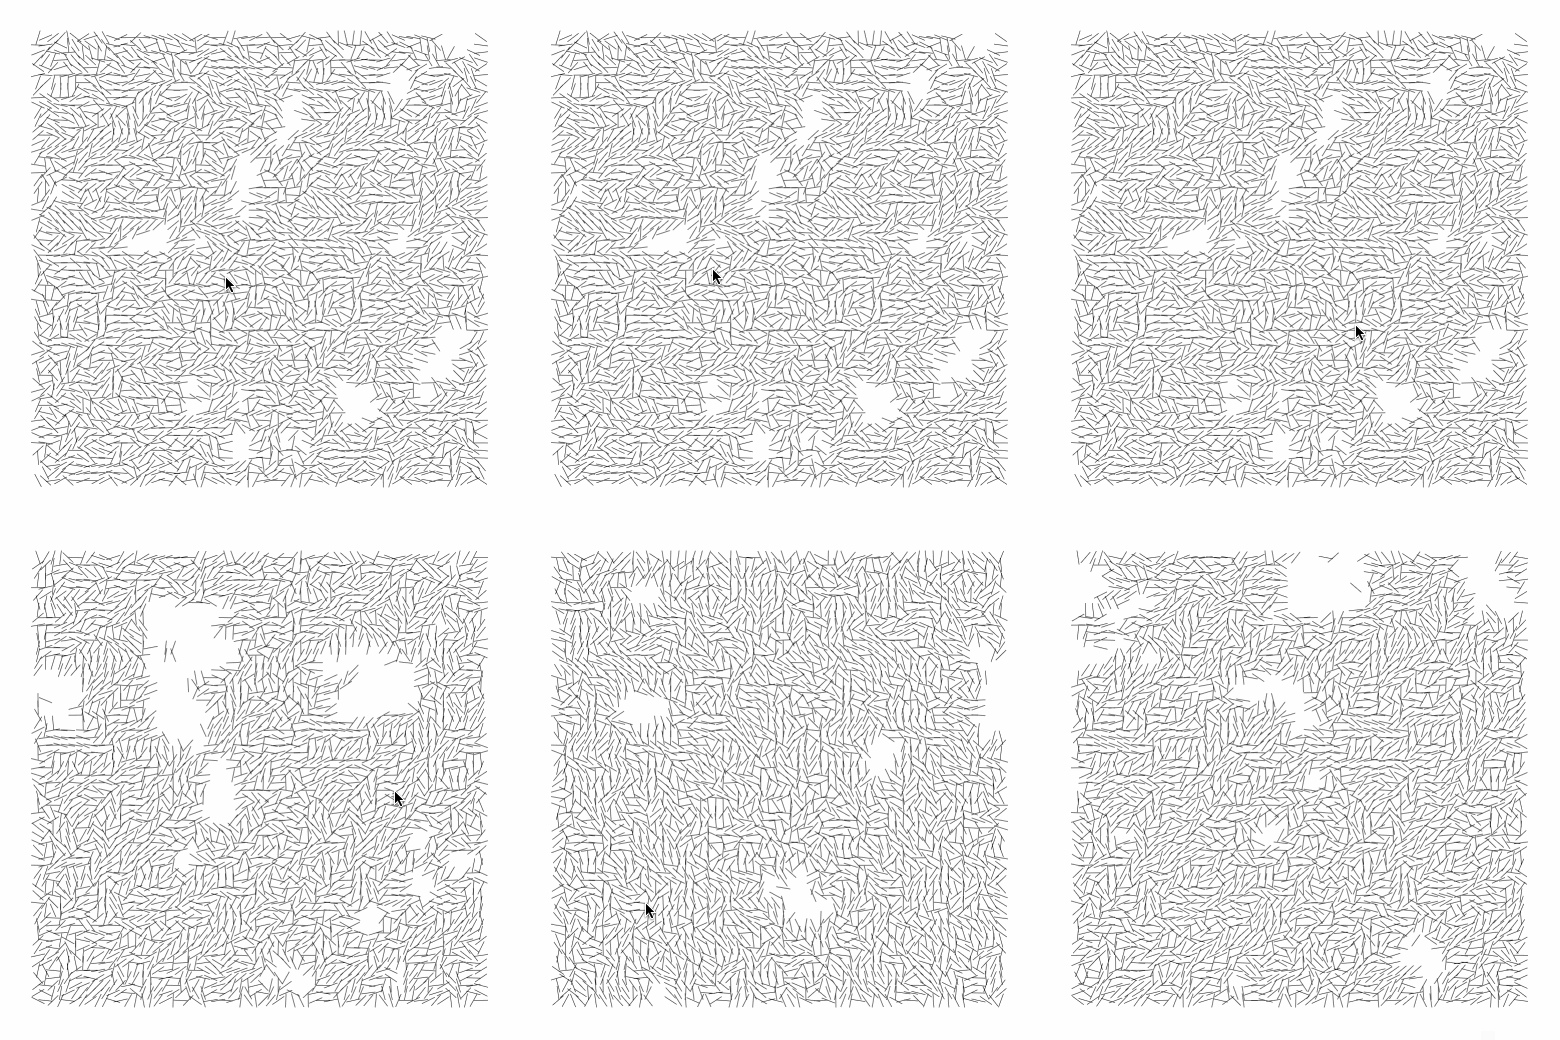
joxin-Interruptions

My observations of Vera Molnar’s original works:
- the artwork is square
- the artwork has a white background
- the artwork has a lot of lines
- the lines are black
- the lines are equal-length
- the lines are short and very thin
- the lines fill the surface, with a little bit of white space near the edge
- the lines are organized in a square-shaped grid with horizontal rows and and vertical columns
- there are around 60 lines each row and each column
- the center points of the lines align with each other horizontally and vertically
- the horizontal and vertical distance between center points of adjacent lines are consistent in the grid
- the horizontal and vertical distance between center points of adjacent lines are a little more than half of the length of the line
- the black lines are rotated to different angles around their center
- the angles of lines seem random on first glance, but some seem similar to adjacent lines
- in some columns or rows, the angles are pointing to a similarly vertical/horizonal direction
- some lines intersect
- not every position in the grid have lines
- there are empty white spaces in the grid missing a single line or an area of lines
- the areas in the grid missing white lines have various locations and sizes, but they are not so big or so many that they affect the overall square-shape of the grid
Here is what I made:
I started by creating a grid of 60 by 60 lines. Based on my observations, I determined the length of each line relative to the size of the canvas, as well as the distance between the center of each line.
Then, I used Perlin noise to determine the seemingly random angles of all the lines. I first tried to get the angles randomly and noticed that it looked different, so I decided to use Perlin noise instead. For each line, I used the 2D Perlin noise function provided by P5.js to get a value in the range of 0 to 1, based on its row and column index. Then, I mapped this value to an angle, in the range of 0 to 2*Pi. It took me a while to determine the noiseScale value (the usage of which can be seen here), because I didn’t have a good intuition of how noiseScale value affects the distribution of Perlin noise values. I spent quite a bit of time doing “trial and error” and judging by eye, but eventually I found a value that seemed most appropriate for reconstructing Vera Molnar’s original work.
I then managed to create a new set of lines every time the user’s mouse clicks. Perlin noise values are fixed for the lifespan of the program, so I can’t use the same row and column indices as seeds to find a new noise value every time. Therefore, my solution is to create an offset value, which is instantiated on line 38 of my code. I used it to offset Perlin noise value by a different amount every time a new set of lines are generated, to make the new set of lines different from the previous.
The next step, finding where to place white space, is the most difficult part. I created a second layer of Perlin noise with a new noiseScale value for the 2D grid, as well as a mid-pass filter, which only allows lines whose noise values are in range to be drawn. My lack of intuition made it difficult for me to find the appropriate noise value for this purpose. There was the challenge of Perlin noise being fixed, and I solved this by using a new, randomly generated offset value to offset Perlin noise seeds each time I want to a new set a lines. I also realized that the distribution of values of Perlin noise is not linear in its range. This caused me a lot of trouble for finding the best filter.
After lots of trial and error, I eventually found the values I was happy with.
Here is my code:
1 2 3 4 5 6 7 8 9 10 11 12 13 14 15 16 17 18 19 20 21 22 23 24 25 26 27 28 29 30 31 32 33 34 35 36 37 38 39 40 41 42 43 44 45 46 47 48 49 50 51 52 | var len = 15; var margin = 45; var n = 60; var noiseScale = 0.47; // for making angles for lines var noiseScale2 = 0.19; // for making filter for white space function setup() { var w = margin * 2 + (n-1) * len/2.0; createCanvas(w, w); background(250); mousePressed(); } function draw() { } function mousePressed() { var lines = []; var noise2Offset = random(0, 10000); noiseScale2 = random(0.09, 0.17); for (var i = 0; i < n; i++) { for (var j = 0; j < n; j++) { lines.push([]); var x = margin + len/2.0 * i; var y = margin + len/2.0 * j; var noi = noise(i*noiseScale, j*noiseScale); var noi2 = noise((noise2Offset + i)*noiseScale2, (noise2Offset + j)*noiseScale2) * 100; var a = noi * 2 * PI; var l = {x: x, y: y, a: a, f: noi2}; lines[i].push(l); } } drawAll(lines); } function drawAll(lines) { background(255); strokeWeight(0.5); var offset = random(-PI, PI); for (var i = 0; i < n; i++) { for (var j = 0; j < n; j++) { var l = lines[i][j]; var x1 = l.x + (len-1) * cos(l.a + offset) / 2.0; var x2 = l.x - (len-1) * cos(l.a + offset) / 2.0; var y1 = l.y + (len-1) * sin(l.a + offset) / 2.0; var y2 = l.y - (len-1) * sin(l.a + offset) / 2.0; if (l.f > 14 && l.f < 63) { line(x1, y1, x2, y2); } } } } |