Tesh-AnimatedLoop

For my GIF I wanted to make something minimalist and snappy that feels satisfying to watch. The shapes are generated by lines whose endpoints I am interpolating between start and end positions using the Penner Ease Out Elastic function. This easing function starts at “0,” overshoots and then comes back to “1,” which gives it a more abrupt ending than other functions and emphasizes the end positions. I then added a shadow to make the shape in the center pop out more, and then brought it forwards to change the background color to allow for a smooth loop.
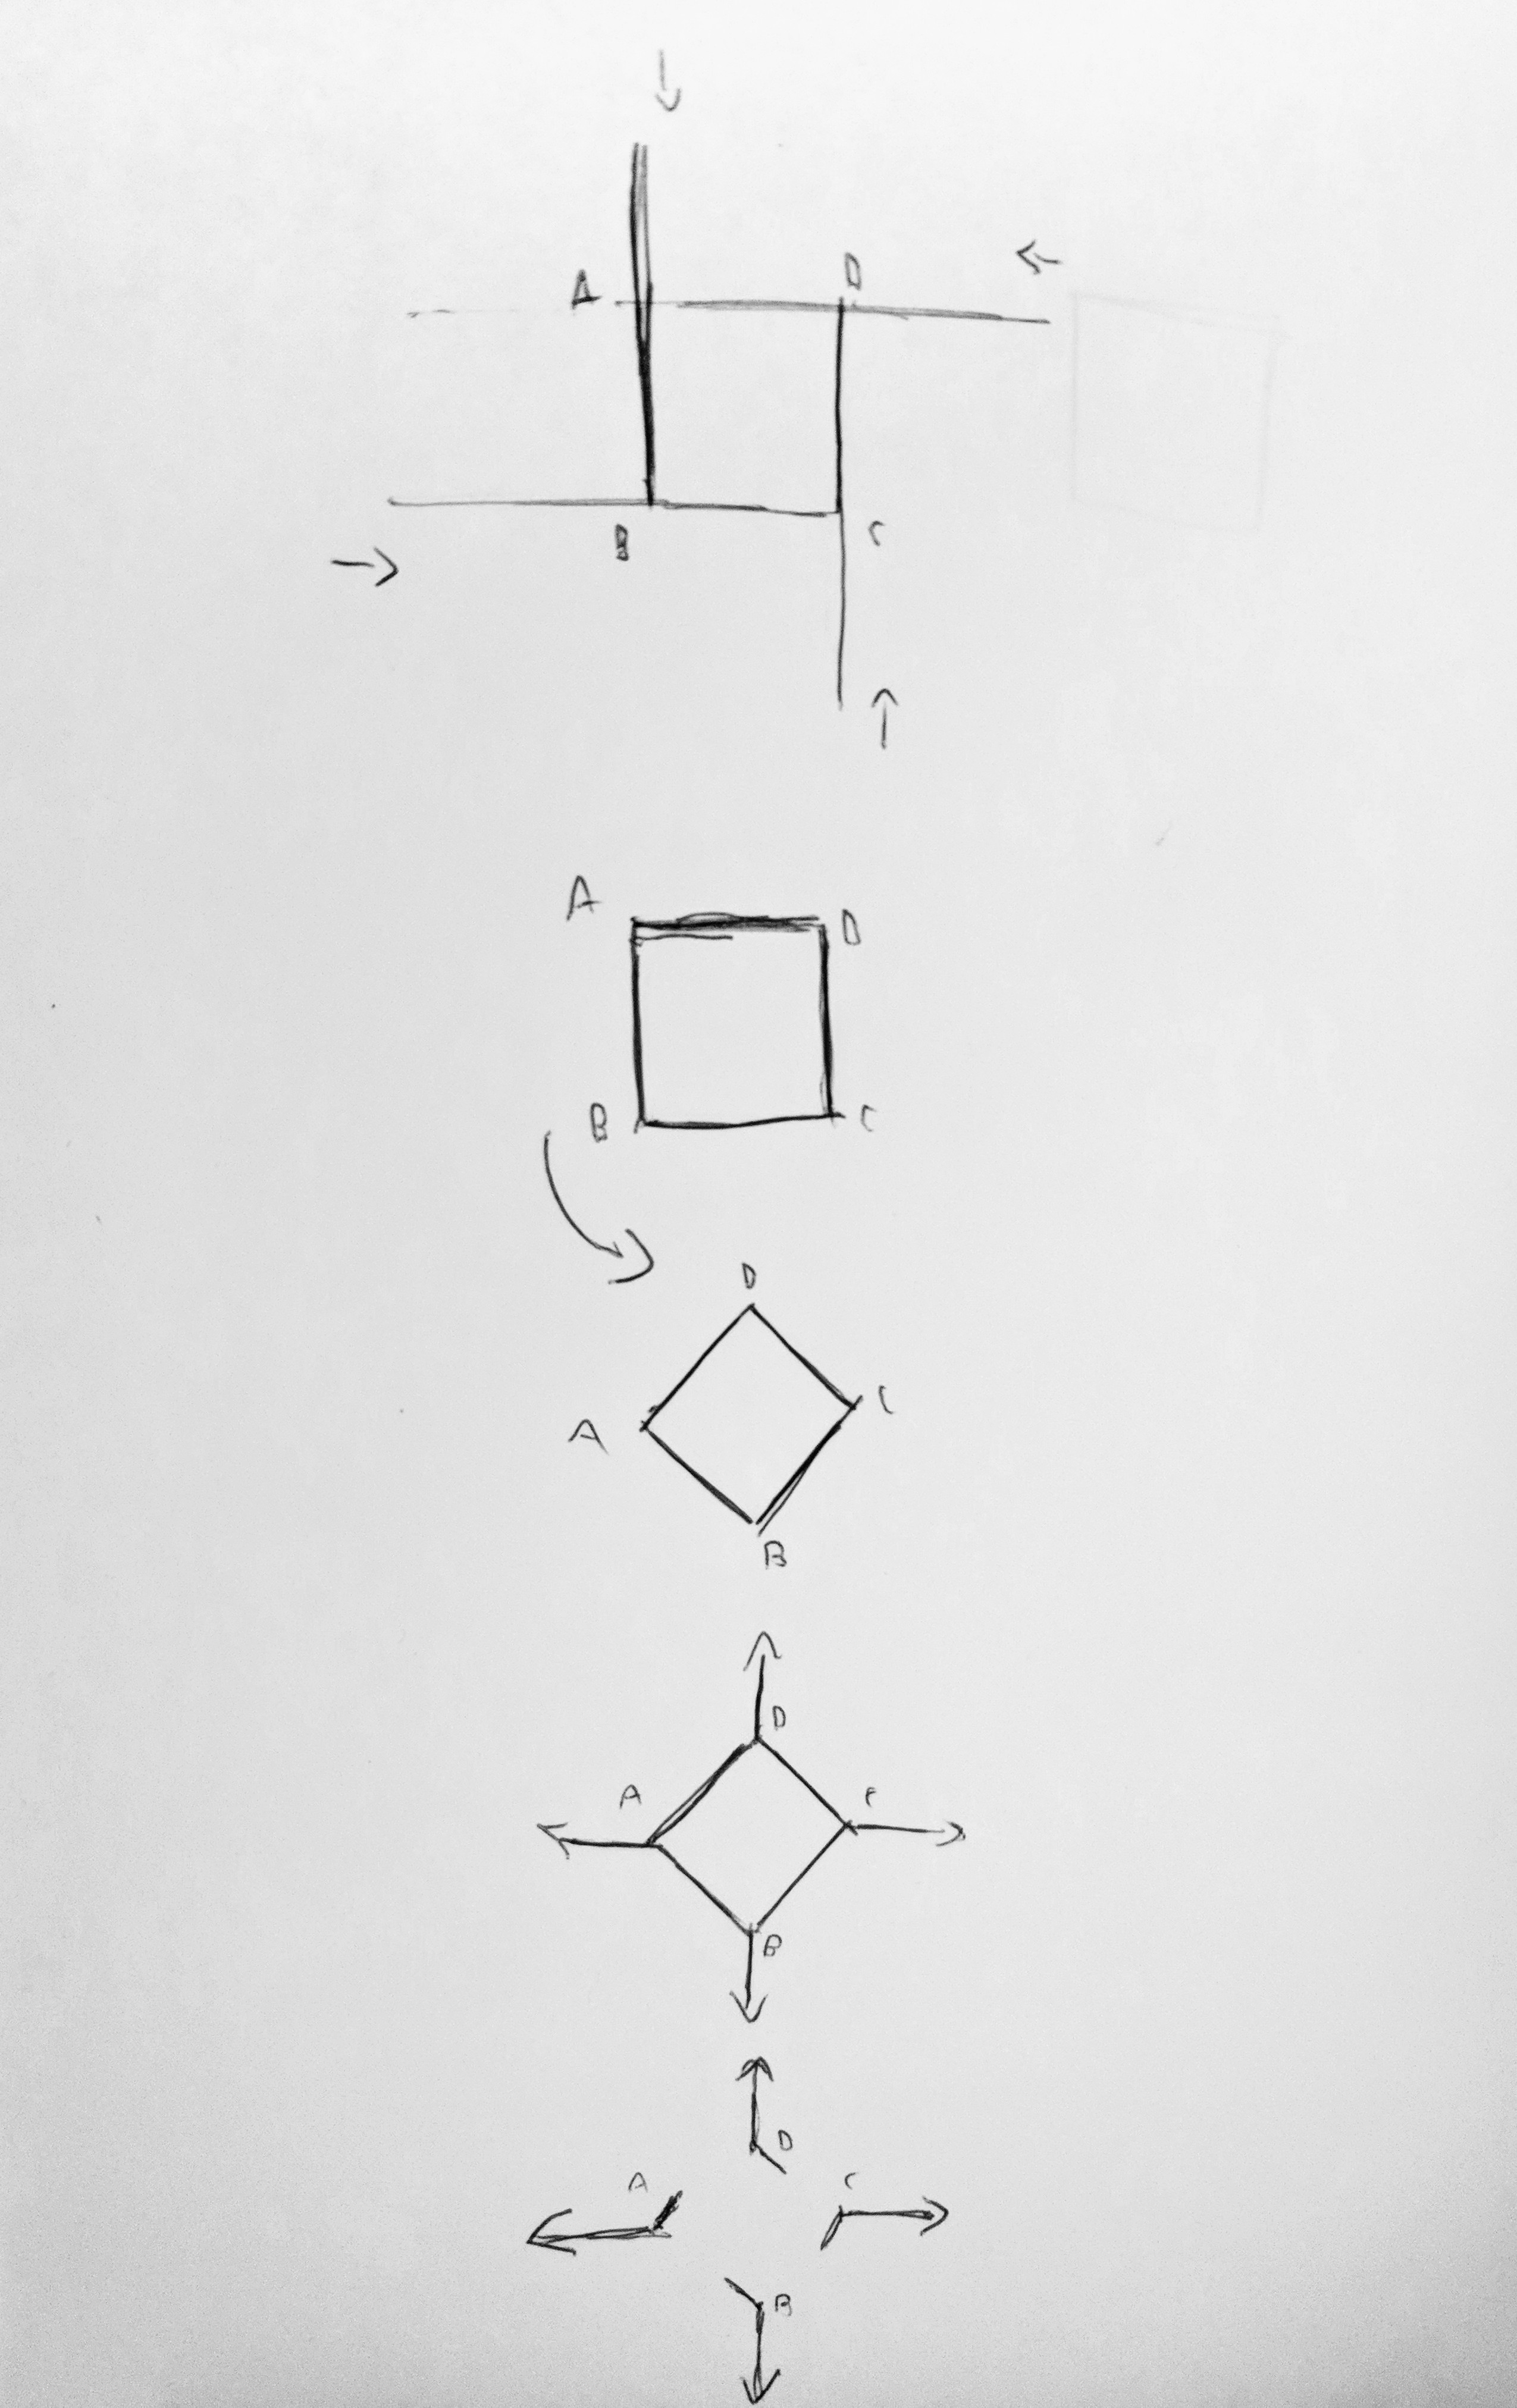
The hardest part for me was figuring out the design concept I wanted to go for. I knew I wanted it to be snappy so I found that function first, and I originally had the lines break away and run offscreen rather than having the shape increase to fill the screen. I would like to add more complexity to this animation but I am struggling to find where to add more without reworking some of the underlying framework. I think adding more points and creating an animation that transitions between more shapes would also probably make the GIF a lot more interesting.
1 2 3 4 5 6 7 8 9 10 11 12 13 14 15 16 17 18 19 20 21 22 23 24 25 26 27 28 29 30 31 32 33 34 35 36 37 38 39 40 41 42 43 44 45 46 47 48 49 50 51 52 53 54 55 56 57 58 59 60 61 62 63 64 65 66 67 68 69 70 71 72 73 74 75 76 77 78 79 80 81 82 83 84 85 86 87 88 89 90 91 92 93 94 95 96 97 98 99 100 101 102 103 104 105 106 107 108 109 110 111 112 113 114 115 116 117 118 119 120 121 122 123 124 125 126 127 128 129 130 131 132 133 134 135 136 137 138 139 140 141 142 143 144 145 146 147 148 149 150 151 152 153 154 155 156 157 158 159 160 161 162 163 164 165 166 167 168 169 170 171 172 173 174 175 176 177 178 179 180 181 182 183 184 185 186 187 188 189 190 191 192 193 194 195 196 197 198 199 200 201 202 203 204 205 206 207 208 209 210 211 212 213 214 215 216 217 218 219 220 221 222 223 224 225 226 227 228 229 230 231 232 233 234 235 236 237 238 239 240 241 242 243 244 245 246 247 248 249 250 251 252 253 254 255 256 257 258 259 260 261 262 263 264 265 266 267 268 269 270 271 272 273 274 275 276 277 278 279 280 281 282 283 284 285 286 287 288 289 | // This is a template for creating a looping animation in p5.js (JavaScript). // When you press the 'F' key, this program will export a series of images into // your default Downloads folder. These can then be made into an animated gif. // This code is known to work with p5.js version 0.6.0 // Prof. Golan Levin, 28 January 2018 // INSTRUCTIONS FOR EXPORTING FRAMES (from which to make a GIF): // 1. Run a local server, using instructions from here: // https://github.com/processing/p5.js/wiki/Local-server // 2. Set the bEnableExport variable to true. // 3. Set the myNickname variable to your name. // 4. Run the program from Chrome, press 'f'. // Look in your 'Downloads' folder for the generated frames. // 5. Note: Retina screens may export frames at twice the resolution. //=================================================== // User-modifiable global variables. var myNickname = "Tesh"; var nFramesInLoop = 65; var bEnableExport = true; // Other global variables you don't need to touch. var nElapsedFrames; var bRecording; var theCanvas; //=================================================== function setup() { theCanvas = createCanvas(600, 600); bRecording = false; nElapsedFrames = 0; } //=================================================== function keyTyped() { if (bEnableExport) { if ((key === 'f') || (key === 'F')) { bRecording = true; nElapsedFrames = 0; } } } //=================================================== function draw() { // Compute a percentage (0...1) representing where we are in the loop. var percentCompleteFraction = 0; if (bRecording) { percentCompleteFraction = float(nElapsedFrames) / float(nFramesInLoop); } else { percentCompleteFraction = float(frameCount % nFramesInLoop) / float(nFramesInLoop); } // Render the design, based on that percentage. // This function renderMyDesign() is the one for you to change. renderMyDesign(percentCompleteFraction); // If we're recording the output, save the frame to a file. // Note that the output images may be 2x large if you have a Retina mac. // You can compile these frames into an animated GIF using a tool like: if (bRecording && bEnableExport) { var frameOutputFilename = myNickname + "_frame_" + nf(nElapsedFrames, 4) + ".png"; print("Saving output image: " + frameOutputFilename); saveCanvas(theCanvas, frameOutputFilename, 'png'); nElapsedFrames++; if (nElapsedFrames >= nFramesInLoop) { bRecording = false; } } } //=================================================== function renderMyDesign(percent) { // // THIS IS WHERE YOUR ART GOES. // This is an example of a function that renders a temporally looping design. // It takes a "percent", between 0 and 1, indicating where we are in the loop. // Use, modify, or delete whatever you prefer from this example. // This example uses several different graphical techniques. // Remember to SKETCH FIRST! var size = 30; var func; var func2; var func3; var timeInt = millis() / 1000; var A; var B; var C; var D; if (timeInt < 3) background(254, 86, 34); else if (timeInt >= 3 && timeInt <3.4) background(lerpColor(color(254, 86, 34), color(160, 90, 94), function_PennerEaseOutElastic((millis() % 1000) / 1000))); else background(160, 90, 94); if (timeInt <= 2) { func = width / 3 * function_PennerEaseOutElastic((millis() % 1000) / 1000); func2 = width / 3; func3 = func2; } else if (timeInt <= 2) { func = width / 3; func2 = width / 3; func3 = func2; } else if (timeInt <= 3) { func = lerp(width / 3, width / 2 - width / 6 * sqrt(2), function_PennerEaseOutElastic((millis() % 1000) / 1000)); func2 = lerp(width / 3, width / 2, function_PennerEaseOutElastic((millis() % 1000) / 1000)); func3 = width / 2 - width / 6 * sqrt(2); } else if (timeInt <= 4) { func = width / 2 - width / 6 * sqrt(2); func2 = width / 2; func3 = lerp(width / 2 - width / 6 * sqrt(2), -45, function_PennerEaseOutElastic((millis() % 1000) / 1000)); } else if (timeInt <= 5) { func = lerp(width / 2 - width / 6 * sqrt(2), -320, function_PennerEaseOutElastic((millis() % 1000) / 1000)); func2 = width / 2; func3 = -45; } /*ellipse(func2,func,size,size); ellipse(width-func,func2,size,size); ellipse(func,height-func2,size,size); ellipse(width-func2,height-func,size,size); */ stroke(0, 0, 0); strokeWeight(3); /*A = point(func2,func); B = point(width-func,func2); C = point(width-func2,height-func); D = point(func,height-func2); */ if (timeInt <= 1) strokeWeight(0); line(func2, func, width - func, func2); line(width - func, func2, width - func2, height - func); line(width - func2, height - func, func, height - func2); line(func, height - func2, func2, func); var off = 12; stroke(215, 76, 74); strokeWeight(0); if (timeInt == 2) strokeWeight(lerp(0, 15, function_PennerEaseOutElastic((millis() % 1000) / 1000))); else if (timeInt > 2) strokeWeight(15); strokeCap(SQUARE); line(func2 + off, func, width - func + off, func2); strokeCap(PROJECT); line(width - func + off, func2, width - func2 + off, height - func); //line(width-func2+off,height-func,func+off,height-func2); //line(func+off,height-func2,func2+off,func); stroke(0); if (timeInt < 3) stroke(0, 0, 0, 0); strokeWeight(4); line(func2, func, func2, func3); line(width - func, func2, width - func3, func2); line(width - func2, height - func, width - func2, height - func3); line(func, height - func2, func3, height - func2); strokeWeight(1); fill(254, 86, 34); beginShape(); vertex(func2, func); vertex(width - func, func2); vertex(width - func2, height - func); vertex(func, height - func2); vertex(func2, func); endShape(); /* //---------------------- // here, I set the background and some other graphical properties background(180); smooth(); stroke(0, 0, 0); strokeWeight(2); //---------------------- // Here, I assign some handy variables. var cx = 100; var cy = 100; //---------------------- // Here, I use trigonometry to render a rotating element. var radius = 80; var rotatingArmAngle = percent * TWO_PI; var px = cx + radius * cos(rotatingArmAngle); var py = cy + radius * sin(rotatingArmAngle); fill(255); line(cx, cy, px, py); ellipse(px, py, 20, 20); //---------------------- // Here, I use graphical transformations to render a rotated square. // Notice the use of push(), pop(), translate(), etc. push(); translate(cx, cy); var rotatingSquareAngle = percent * TWO_PI * -0.25; rotate(rotatingSquareAngle); fill(255, 128); rect(-40, -40, 80, 80); pop(); //---------------------- // Here's a linearly-moving square var squareSize = 20; var topY = 0 - squareSize - 2; var botY = height + 2; var sPercent = (percent + 0.5)%1.0; // shifted by a half-loop var yPosition = map(sPercent, 0, 1, topY, botY); fill(255, 255, 255); rect(230, yPosition, 20, 20); //---------------------- // Here's a sigmoidally-moving pink square! // This uses the "Double-Exponential Sigmoid" easing function // ripped from From: https://idmnyu.github.io/p5.js-func/ // Really, you should just include this library!! var eased = doubleExponentialSigmoid (percent, 0.7); eased = (eased + 0.5)%1.0; // shifted by a half-loop, for fun var yPosition2 = map(eased, 0, 1, topY, botY); fill (255, 200, 200); rect (260, yPosition2, 20, 20); //---------------------- // Here's a pulsating ellipse var ellipsePulse = sin(3.0 * percent * TWO_PI); var ellipseW = map(ellipsePulse, -1, 1, 20, 50); var ellipseH = map(ellipsePulse, -1, 1, 50, 30); var ellipseColor = map(ellipsePulse, -1, 1, 128, 255); fill(255, ellipseColor, ellipseColor); ellipse(350, cy, ellipseW, ellipseH); //---------------------- // Here's a traveling sine wave stroke(0, 0, 0); for (var sy = 0; sy <= height; sy += 4) { var t = map(sy, 0, height, 0.0, 0.25); var sx = 450 + 25.0 * sin((t + percent) * TWO_PI); ellipse(sx, sy, 1, 1); } //---------------------- // Include some visual feedback. fill(255, 0, 0); noStroke(); textAlign(CENTER); var percentDisplayString = "" + nf(percent, 1, 3); text(percentDisplayString, cx, cy - 15); */ } // symmetric double-element sigmoid function (a is slope) // See https://github.com/IDMNYU/p5.js-func/blob/master/lib/p5.func.js // From: https://idmnyu.github.io/p5.js-func/ //=================================================== function doubleExponentialSigmoid(_x, _a) { if (!_a) _a = 0.75; // default var min_param_a = 0.0 + Number.EPSILON; var max_param_a = 1.0 - Number.EPSILON; _a = constrain(_a, min_param_a, max_param_a); _a = 1 - _a; var _y = 0; if (_x <= 0.5) { _y = (pow(2.0 * _x, 1.0 / _a)) / 2.0; } else { _y = 1.0 - (pow(2.0 * (1.0 - _x), 1.0 / _a)) / 2.0; } return (_y); } function function_PennerEaseOutElastic(t) { if (t == 0) return 0.0; if (t == 1) return 1.0; var p = 0.3; var s = p / 4; return (pow(2, -10 * t) * sin((t - s) * (2 * PI) / p) + 1); } |