Susan Lin — InfoViz, Sketch
As encouraged, this is the simplest, most viable idea. Probably best if I’m not the strongest coder and running a cold for the week…
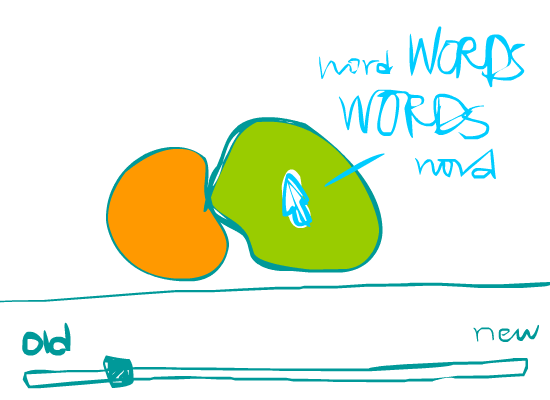
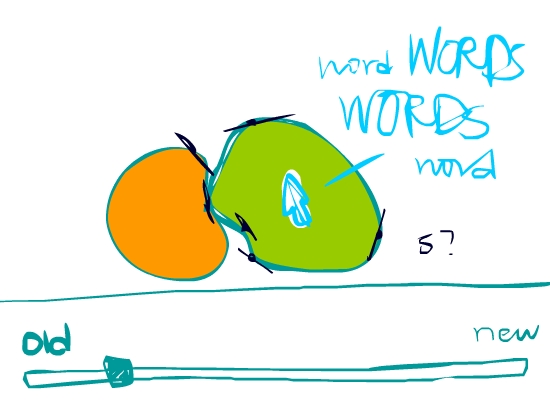
In the simplest form, I’d like my idea to visualize the growing or shrinking arguments on both sides (for or against the Chinese mother). The interface in mind is simple: like a video player. The user can drag between old and new and watch the blobs change.

When hovering over either blob at any given spot, the user will be given the most prevailing argument (as measured by the number of inline comments) and words (count frequency of word in the area maybe +/- 25 comments.

The blobs themselves will be driven by word counts as well… After figuring out which are the top 5 words in a 50 comment radius, the change in the count (positive or negative) will affect one point on the blob dragging it in forms. (Haven’t looked into what language to use, but *something’s* gotta be able to support this right?
This lava lamp-esque means of visualizing a firey argument also intrigues me.. If the blobs expand into each other, they will repel.

Perhaps the blobs could be 2 competing word clouds? There are some word/tag cloud examples for Processing.