Susan Lin — InfoViz, Final
Visualizing a Flaming Thread
InfoViz based off of WSJ article “Why Chinese Mothers are Superior” comments thread.
—
This is a looong post, so here’s a ToC:
- The Static Visualization
- Everything Presented Monday
- Process Beginnings
- Pitfalls
- Retrospective
—
The Static Visualization

As per the advice during the critique, I create a infographic based off the static variant of my project. I decided to keep the 10×100 grid layout for aesthetic reasons (not having 997 bubbles all in one row and thus making a huge horizontal graphic).

This alternative version of the above offers the same thing with the areas of interest highlighted.
—
Everything Presented Monday
Links for everything pre-critique.
- Presentation (via Prezi).
- Original Animation, YouTube video, flouncyBalls source.
- Original Static, plottedBalls source.
—
Process Beginnings
Like mentioned, the data source of interest was this WSJ Article. The article sparked some serious debate leading to threads such as these. Here is a particularly powerful answer from the Quora thread from an anon user:
Drawing from personal experience, the reason why I don’t feel this works is because I’ve seen an outcome that Amy Chua, the author fails to address or perhaps has yet to experience.
My big sister was what I used to jealously call “every Asian parent’s wet dream come true” [… shortened for conciseness …]
Her life summed up in one paragraph above.Her death summed up in one paragraph below.
Committed suicide a month after her wedding at the age of 30 after hiding her depression for 2 years.
I thought the discussion around it, though full of flaming, was very rich with people on both ends of the spectrum chiming in. My original idea was to take apart the arguments and assemble it in a form which would really bring out the impact, similar to the excerpt from Quora.
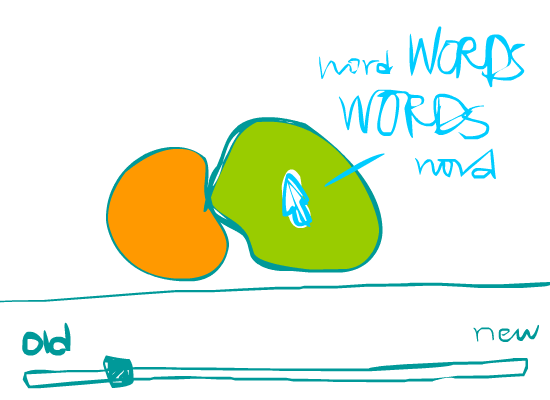
I started off with the idea of having two growing+shrinking bubbles “battle.” More information can be read on this previous post.

This was the baseline visual I devised:
- Green and Orange balls collide with each other.
- Collision: green does not affect green, likewise, orange did not affect orange.
- Colliding with opposition shortens your life span (indicated by opacity).
- Touching an ally ups your life span.
Giving credit where credit is due:
The code started with Bouncy Balls and was inspired by Lava Lamp.

Next, I wanted to see if I could work some words into the piece. Word Cloud was an inspiration point. In the final, I ended up using this as the means of picking out the words which charged comments usually contained: parent, Chinese, and children.
Cleaning up the data:
- When I downloaded the RSS feed of the comments, it was all in one line of HTML (goody!).
- With some help, I learned how to construct a Python script to organize it.
- Basically, the code figures out where each time stamp and comment is relative to the mark-up patterns, and separates the one line out to many lines.
import re

f = open('comments.html', 'r')

text = ''
for line in f:

    while 1:
        m = re.search('#comment.*?#comment\d+', line)
        if m is None:
            break

        comment = line[:m.span()[1]]
        n = comment.find("GMT") + 4
        text += comment[:n] + "\n"
        text += comment[n:] + "\n\n"

        line = line[m.span()[1]:]
f.close()

f2 = open('comments-formatted.html', 'w')
f2.write(text)
f2.close() |
Sources: comments.html, comments-formatted.html
More looking outwards:

While working, I often took a break by browsing Things Organized Neatly. It served both as motivation, inspiration, and admittedly procrastination. Also, if I could revise my idea, maybe something interesting to look at in a future project would be commonly used ingredients in recipes (inspired by above photo taken from the blog).
—
Pitfalls
The greatest downer of this project was discovering that language processing was actually quite hard for a novice coder to handle. Here were abandoned possibilities, due to lack of coding prowess:
- LingPipe Sentiment Analysis – This would have been really freaking cool to adapt this movie review polarity to a ‘comment polarity’ analysis, but unfortunately, this stuff was way over my head.
- Synesketch – Probably would have been a cool animation, but didn’t get to show two emotions at once like the original idea desired.
- Stanford NLP – Again, admired this stuff, but way over my head.
—
Retrospect
In no order, some of the things I learned and discovered while doing this project.
- Language processing is still a new-ish field, meaning, it was hard to find a layman explanation and adaptation. It would have been nice to do more sophisticated language processing on these comments, but language processing is a monster on its own to tackle.
- Vim is impressive. I now adore Vim users. (Learned during the Python script HTML clean-up portion of this project.)
- Mechanical Turk: This might have been an alternative after figuring out language processing was hard to wrangle. Though building a framework to harvest this data is unfamiliar territory as well (probably with its own set of challenges).
- Another field: I really wanted to map this variable out, especially after harvesting it, but the time stamp was not used. An animation with the time stamps normalized by comment frequency may have added another layer of interpretation. Addition: Though, from the critique, it seems like more layers would actually hurt more than help. Still, I wonder if in the static visualization the time stamp could have added.
- All-in-all: I thought this was parsed down to the simplest project for 2+ weeks… This clearly wasn’t the case. Lesson: Start stupidly simple next time!
- As for things that went well: I forced myself to start coding things other than simple mark-up again, which is very pleasing when things come together and start working.
- I am pleased with the combined chaos+order the project exudes (lava lamp on steroids?). The animation made for a poor visualization compared to the static version even though I spent 80% of my time getting the animation to work. On the bright side, I would have never found out without trying, so next time things will be different.
Comments from the PiratePad:
Really dig the Prezi. not enough fonts though…
I kinda like the Prezi thing.
NLP = ? Natural Language Processing
Was this a manual tagging of every comment?
I prefer the static chart.
Interesting conclusion that negative people are more verbose in their comments.
Nice comment view although the movement of the bubbles is not easy to understand.
Why do they disappear suddenly?
Can you put part of the comment in the bubble to contextualize it? So we understand the bubble.
Use some regular expressions to filter out the html
stuff
I’m not sure if the animation adds much value to the visualization? It’s kinda overwhelming.
Aesthetically amazing work.
the first data viz doesn’t provide a lot of information for analysis…second viz is better…i’d still like to know what the most frequently used words are. static result is visually engaging.
Nice color combinations. Really pretty.
Greate concept….It would be cool if the bubbles went a little slower.
I wish I could slow it down and read the individual comments. Needs a pause button. With message view if you mouse over the bubbles.
I like how many things you’re trying. Agreed (same here!).It’s great to see the process.
I enjoy the animated version of the comments, thought I think the static one gives more information about what’s going on. The propagation effect of the comments is very interesting.
I like the animation in your visualization, as well as the color choices. It definitely communicates an interesting interaction between the different types of comments and arguments being made. The static visualization maybe could have benefited from another layer of information to give it more context. I was a little confused about what I was looking at, but overall great job!
Text analysis (NLP) is indeed difficult. Check out free Java tools like the Stanford NLP Libraries, the LIWC, and many others. You don’t have to do it all yourself!
What accounts for the motion in the bubbles animation? The physics is overpowering, and I’m not certain how (or if) the motion is linked to meaningful information. See Ben Fry’s masters’ thesis where he discusses “information metabolism” — the idea of visualizing data through the dynamics of an animated system.
The static diagram is more successful. Would it have worked to have 2 parallel timelines, one for positive and one for negative comments.
A legend would be very helpful for clarificaiton of the colors and sizes.
It would be nice if you could click on a bubble to see the post, and maybe line/links to the replies.
I think there are a lot of assumptions made in the data process that aren’t communicated clearly in the final product. I like the project, and think that you have interesting data and a good story to communicate, but it is hard to read the result.
The bubbles’ movements look great, but I think the chart is significantly more effective. The kinetic visualization is not very readable.
What does this communicate about the issue?
You should remove the html tags from the comments if you are going to display them on the screen
I like that the text can be made visible, but maybe clean it up a little… I agree that a legend could be helpful for the bouncing animaiton. The static one is much more readable.
Whether or not the bubbles hit each other, is this based on when they were posted or something? You have some html markup in the comment display :( but I appreciate that you give a way to look at the text
is the animation/playback running over time? it seems a bit fast
ok, so each bubble of the same color keeps other bubbles going
you could use some explanation for the moving bubbles
the time domain image is very nice
I can imagine the bubble animations being integrated with the tag cloud where the relvent wirds from each comment are drawin within the bubbles
This is a great concept – I think the natural language processing would be a pain, but it looks like you’ve done a decent job of colorizing the bubbles as either poisitive or negative. It’d be cool if the X and Y positions of the bubbles in the animation mapped to something.
Great design asthetic to the infoviz. And the sizing and colors make sense. render out that html.
The static bubble presentation is really cool – it’s visually appealing to see how there’s feedback to large, negative comments. Angry people write more!
Cool idea, but I would have no idea what the visualization is without you explaining it — it almost looks like random bubbles moving around. Are there any patterns across the comments that you found out after doing this?
The visual expression is really cool and I love the idea. Btw, NLP is hard, so as data mining. You may try some existent data mining software which may help you with the data side.