Sarah Keeling; Looking Outwards 2
Sweet Spot
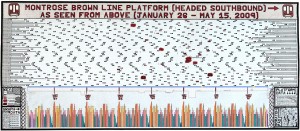
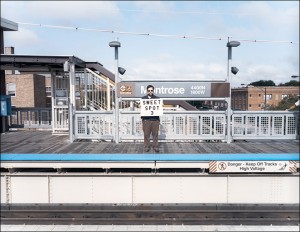
Jonathans Gitelson created the data visualization “Sweet Spot” that shows where to stand on the train platform so that when the train stops, you would be conveniently right in front of the doors. The project consists of a diagram showing where the sweet spots are on the platform as well as a series of photographs of him standing in each “sweet spot”. The idea for the project came from his morning commute into Chicago and the struggle to get a seat on the train during the morning rush. I saw this piece at the Scottsdale Museum of Contemporary Art over the break and thought it might be interesting to look at for its concept and ideas of the different odd data that can be visualized. I think that his approach of making the diagram by hand is unique, but that the way he formatted the information could be done in a different way that would convey the information more effectively.
http://www.thegit.net/sweet_spot
Map of Scientific Collaboration Between Researchers
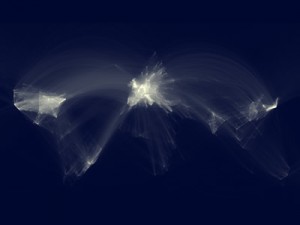

Oliver Beauchesne created a data visualization that mapped where scientific collaborators were from through 2005 to 2009. He got the idea to do so from the Facebook friendship map and decided to make a similar one with a data set from his work. I think it shows interesting patterns and groupings of collaborations that would otherwise not really be known. I also think that data removed, it is a beautiful image and that the abstraction of the map adds to its interest.
http://www.visualcomplexity.com/vc/project_details.cfm?id=747&index=747&domain=
20 Hz
20 Hz was made by Ruth Jarman and Joe Gerhardt (known as Semiconductor) in 2011 and is a bit of a different approach to data visualization than some of the example we have been looking at. They use radio data (captured at 20 Hz) gathered from a geo-magnetic storm in Earth’s upper atmosphere as the audio for the piece. The changes in the sound then generates the visual forms and patterns that appear.