MadelineGannon-Project2-sketch
Visualizing the Burst of the Housing Bubble
For my visualization project, I’ve been exploring data sets that have the potential directly inform the growth or decay of a digital object. I’m interested in creating a visualization that goes beyond re-presenting or re-associating quantitative data (despite it’s effectiveness at transforming data into information.) My goal is to have a visualization that translates cold, hard quantitative data into some sort of qualitative/emotive response from a viewer. I believe this can be done by crafting a collection of tangible objects that exhibit aggregated change over time.
Visualizing
I’ve been looking more and more into the statistical trends leading up to the 2006 housing bubble as a viable data set to visualize aggregated decay. The bubble-burst is of particular interest for me, as my part of the US (S. Florida) was hit very hard, with my hometown leading the nation in mortgage defaults. This fiscal disaster has been more damaging than most of the natural disasters that have hit this region in my lifetime.
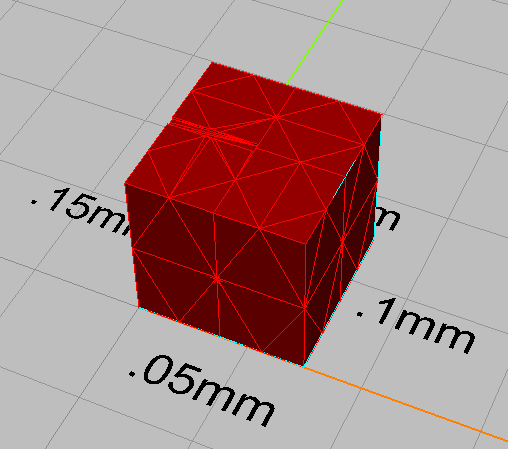
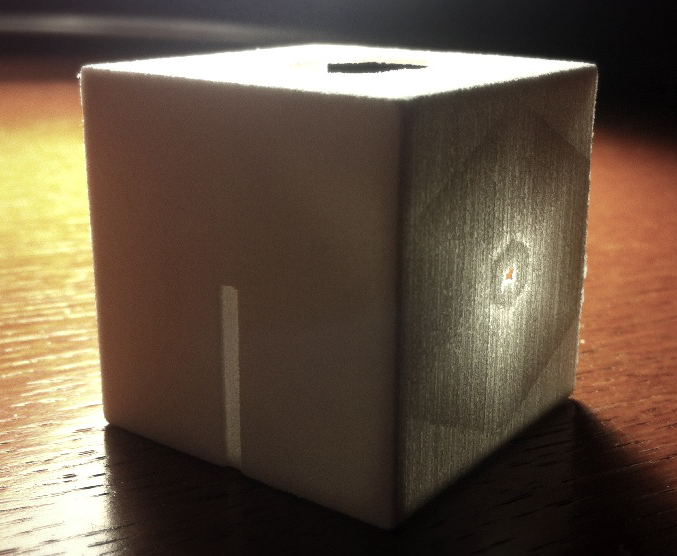
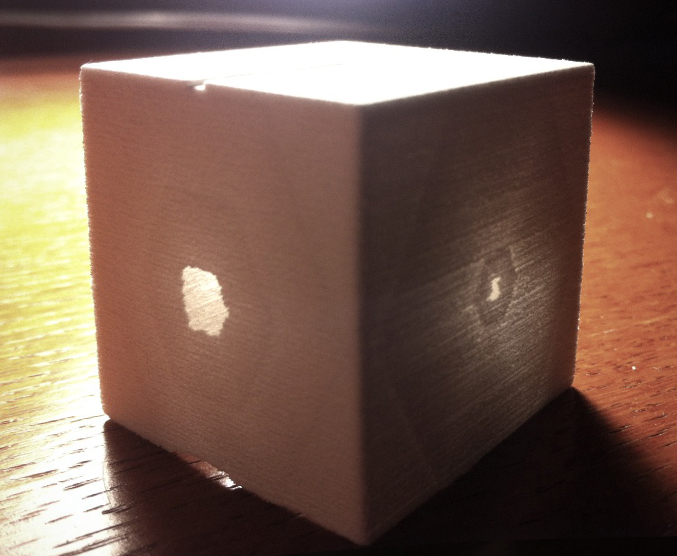
I began experimenting by misusing a plaster 3D printer to convey the sense of neglect / collapse / erosion / detritus that this data set quantifies. The images below show a series of tests that thinned areas of a printed wall beyond the material tolerances of the fabrication machine. I was surprised that the hexagonal mesh structure was expressed through the printing process, however I found that I can have systematic control over how and where the material fails, as well as the levels of opacity/translucency/transparency emitted:

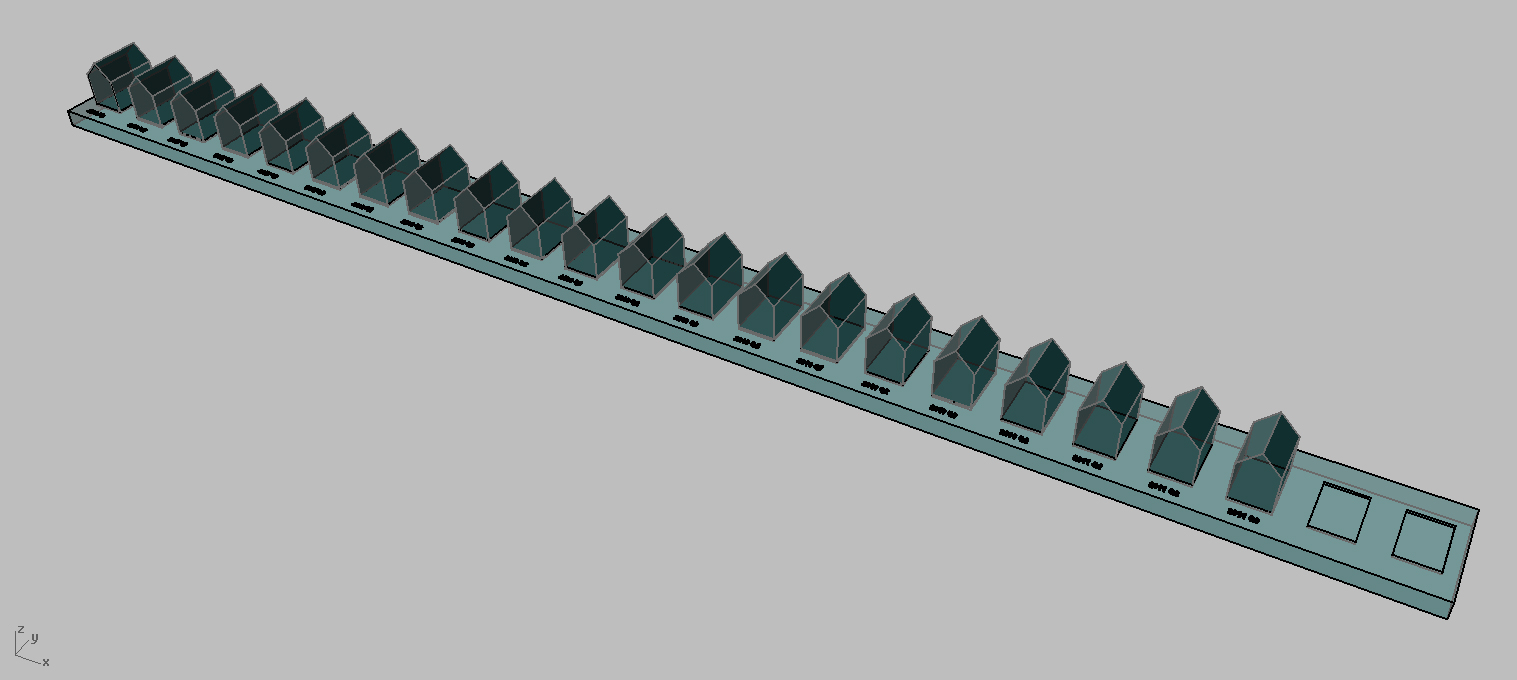
I’m thinking of printing a series of objects, one for each quarter since the bubble-burst, that are deformed based on the corresponding S&P/Case-Schiller index value (with places for future indices as the market continues to find an equilibrium):
Data Set
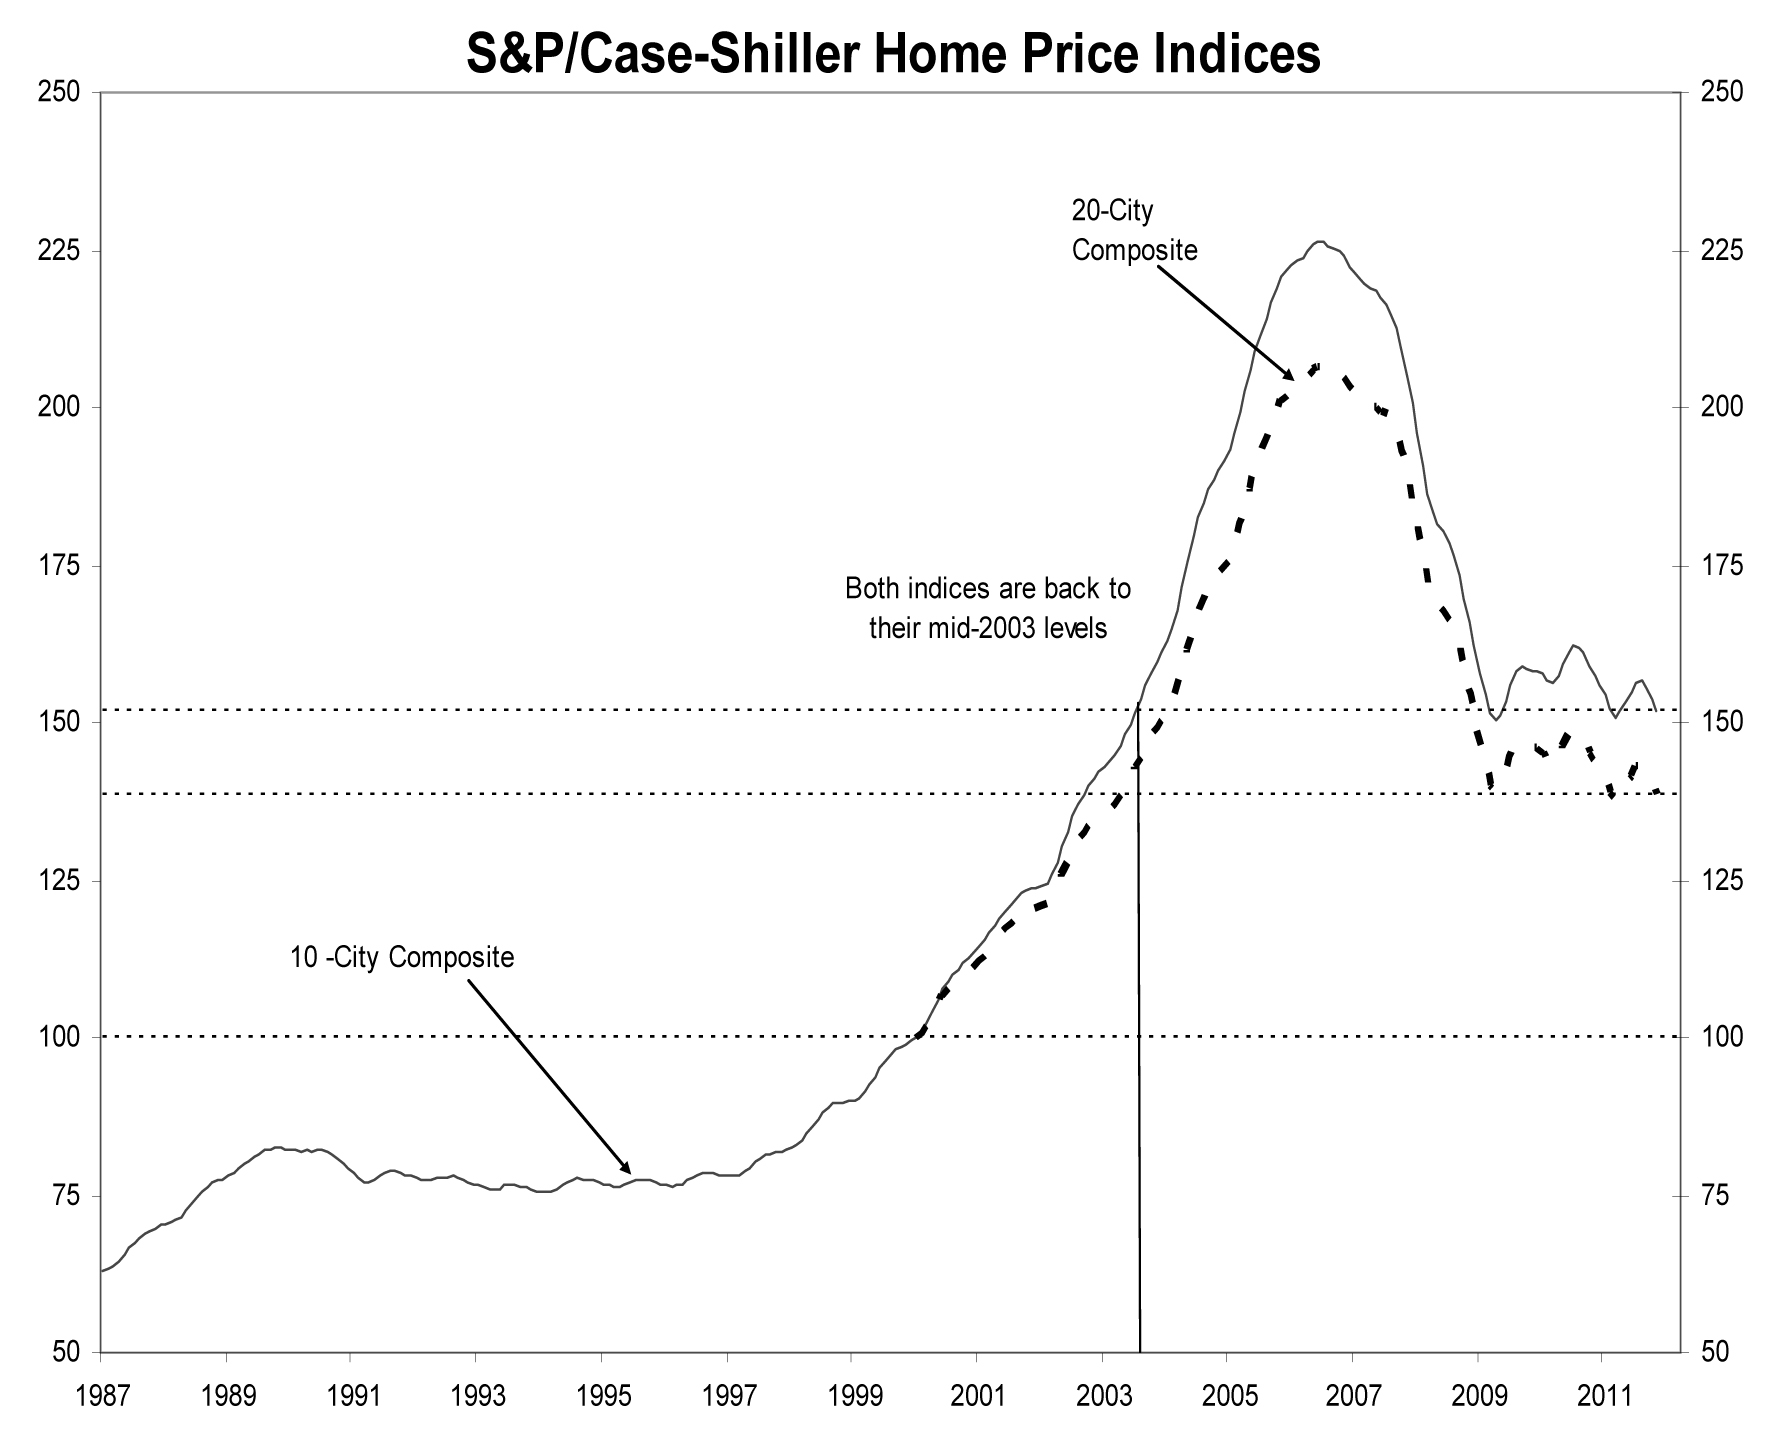
The S&P/Case-Schiller House Price Index is a national standard for gauging the state of the residential real-estate market. The index here shows the 10 and 20-City composite indices, and are quarterly values calculated through the volume of repeat sales of single family homes. The second quarter of 2006 held the all-time historic high for the market, the apex of the housing boom, and was followed by 12 straight quarters of collapse. The past 8 quarters have begun to stabilize, and are currently trending around the 2003 index rates.