Billy Keyes – Project 2 – Things Programmers Also Know
Things Programmers Also Know is a visualization of the knowledge and interests of the 400 highest ranked users on Stack Overflow.
Background
Initially, I was interested in visualizing disinformation, or an idea I called “little myths”: the small rituals we go through, like adjusting TV antennae or standing in particular places for cell phone reception, that may or may not actually influence the outcome. It turned out that collecting this kind of data wasn’t feasible in the time we had, but with the help of some classmates, I arrived on the topic of “Question and Answer” websites. There are many sites in this genre, but Stack Overflow stood out as an popular, practical, and familiar choice.
For those unfamiliar, Stack Overflow is a site dedicated to asking and answering questions about programming and is widely used as a reference by students, amateurs, and professionals. After the success of Stack Overflow, the founders released the underlying technology so that others could make similar topic-specific Q&A sites. The result is the StackExchange (SE) network, which covers topics from server administration to martial arts and LEGO® bricks. Most importantly, there is a single API that gives access to an enormous amount of data about all the sites in the SE network.
[vimeo 36477715]
Initial Approach
I started by looking at the top questions and tags on Stack Overflow. Unfortunately, the results were boring and predictable: the top tags are a list of the most popular programming languages and the top questions are usually people looking for advice on broad, general topics. In the process of sorting though these data, I decided to avoid text-focused visualizations if possible. While exploring the SE API to see what other data I could retrieve, I discovered that user accounts are shared between all SE sites. Given the wide range of topics covered by the network, I suspected there would be interesting trends in people’s interests.
Process
Data is collected by a series of Python scripts using the Py-StackExchange library to handle communication with the API. The scripts collect a list of users from a site, then find all associated accounts, and then query the individual sites to obtain more detailed statistics. While I chose Stack Overflow as the user source, it’s very easy to use any other site in the network as a source. Also, I obtained the highest-ranked users as a side-effect of my query parameters, but with some minor modifications, it is possible to slice other sections of the user base. The scripts output CSV files which are read into a Processing sketch for display.
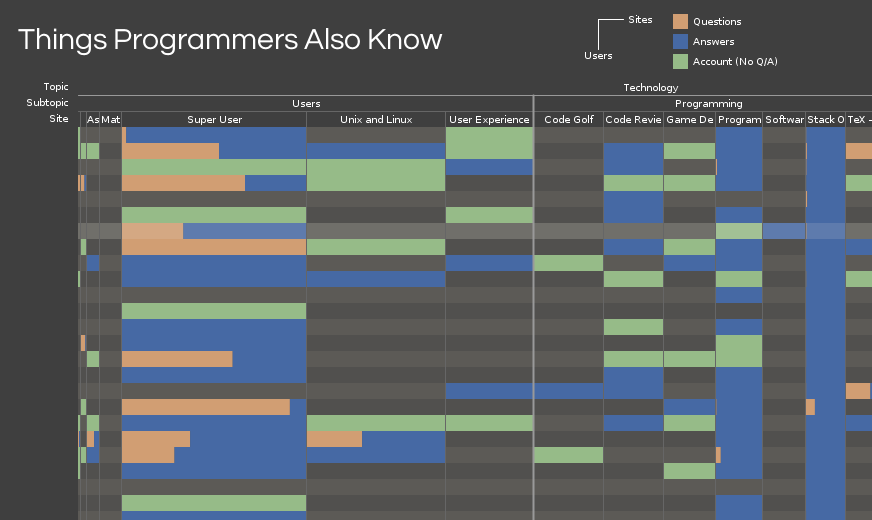
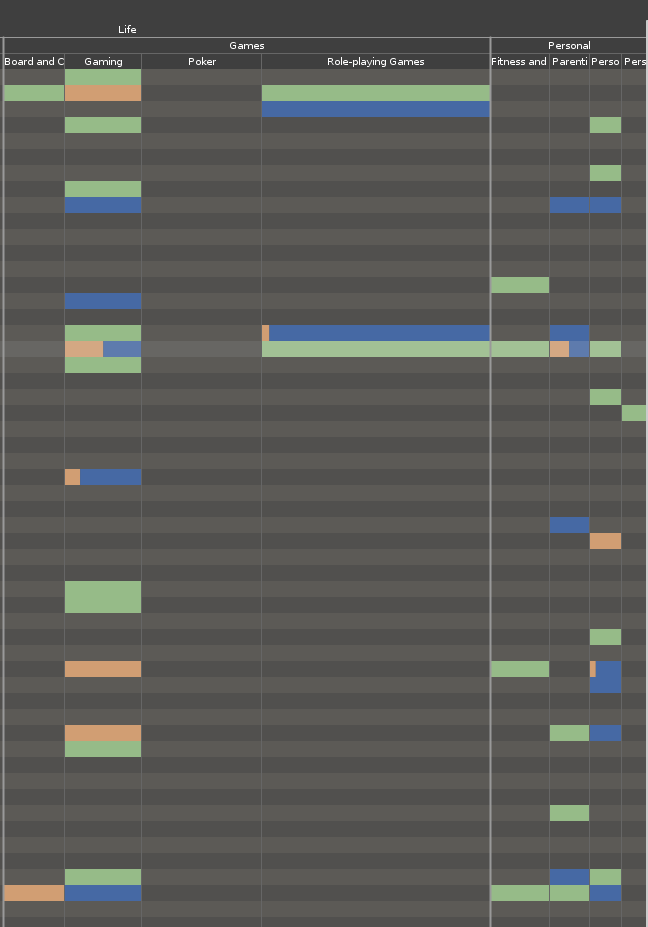
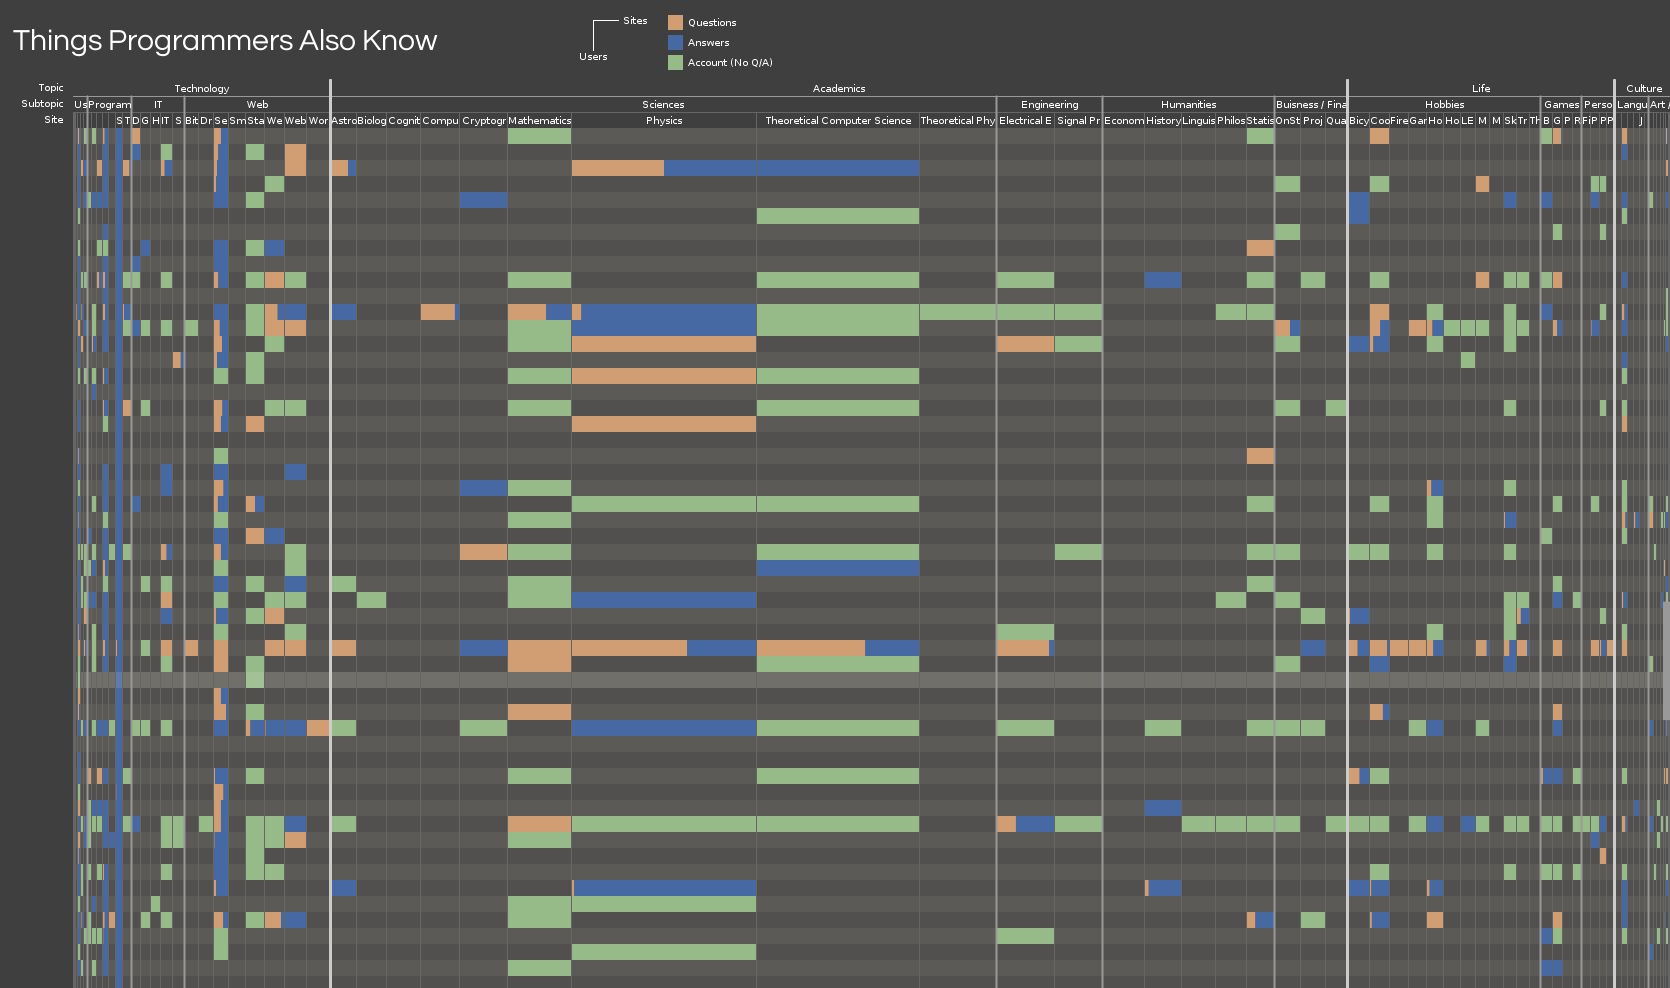
The sketch displays a user-site matrix, with each row representing a user and each column representing a site. If the user has an account on a site, a box is drawn at the intersection of the row and the column. If the user has asked or answered questions on the site, the proportion of questions and answers is drawn in the box. I used parts of Karsten Schmidt’s excellent Toxiclibs libraries to handle zooming and color operations.
Improvements
The zooming effect, while important for viewing the data, is also a little unstable, making it easy to miss columns when panning. There is also support in code for filtering the displayed sites at a site, subcategory, or category level. Unfortunately, this didn’t make it into the interface. I also think it should be possible to put more information into the display by correlating the saturation and brightness of the colors to the user’s reputation or the actual number of questions and answers provided.
Conclusions
I think this works as a simple, effective visualization of the connection data. Trends, particularly in question/answer ratios are easily visible. For instance, most Stack Overflow users ask a lot of questions about server administration compared to the number of questions they answer. I was also surprised to see other sites, like English Language and Usage, have so much overlap with Stack Overflow in users.
I’ve used only a fraction of the data that can be had with the SE API, so I look forward to seeing any other visualizations of information from Stack Exchange network.
Download Things Programmers Also Know (src)
========================================
Billy Keyes: Things Programmers Also Know
Really interesting dataset, I’d love to explore this myself.
weird color scheme. blue needs to be more muted to match rest of palette.a
^ maybe he could use Adobe Kuler next time (thanks Sankalp, I did not know of this before)
I think the color scheme is fine. It’s basically RGB but less obnoxious than fully saturated primaries.
I agree that the color scheme is hard to read, I think the alternating grays are particularly confusing
its hard to read this graph, I see boxes but the text is too small … I think its too complicated, maybe you could have a few different graph types of the same data
* yea i would try to come up with a way to display the are number of data (which it’s awesome that you have so much user data) in a more concise way, maybe even if it was vertical rather than horizontal it would be helpful
pie charts would be useful here I think … etc <-- +1 true dat. I can imagine a small multiples (grid) of pie charts (one per person). Curious! I like this idea, examining the correlation of knowedge across topics, but it is kind of hard to digest. The hover effect is a little disorienting, maybe there's a better way to show all of this information without having the the infoviz move around so much. / I don't think you need to necessarily use hover based zooming to examine the graph +1 maybe instead of the "magnifying glass" effect, just show them all full size, but allow for scrolling around. Maybe have a hierarchy of topics with checkboxes to pick the columns.+1 maybe try the large graph initially but allow sorting out of unwanted columns. I think this is a really cool interactive visualization. You have a lot of great data and it is presented in a way that someone could use to answer their own questions. The zoom effect makes comparisons hard, maybe have some kind of search or filtering interface. I think you nailed the 'data exploration' side of this assignment. It provides me with tons of questions about how these mysterious users lurk around the internets.+1 I wanna get in there and try out some theories. Color scheme is probably not as cool as it could be (use Kuler!) but looks fine imo. I also really like they you described the evolution of your idea, it sounds like you discovered something along the way. If the goal of information visualization is to make information MORE accessible, I don't know what this vis does that a common bar graph or spreadsheet doesn't. The data is interesting and dense enough to give you lots of room to experiment with other forms of vis. One thing I immediately find myself wondering is what are the proportions of users on some of these other StackExchanges that aren't on StackOverflow. If you looked up all the connections starting from the users of the cooking StackExchnage, would these columns be more or less sparsley populated? I also wonder if there's some significance to the fact that the sysadmin column was nearly as full as StackOverflow; I wonder if that indicates that kinds of tech people that participate in StackOverflow are largely web/sys admin people. I really love the premise, since it's a very novel way to look at the users of a large website that lends itself to exploration. The animations and chart display is very cool, but I'm not sure if it's really the best representation for getting the big picture. Since each user is a separate row, it's cool that you can track individual interests, but it makes it a lot harder to get a sense of general trends without going across the row for a lot of users. I like how you "discovered" this data and found something interesting to analyze it with. Good work! I think you need some UI tools for locking, or snapping, the display to a certain column, or a certain row. That way I could investigate the features of a certain user, or of a certain topic. Also, I think one thing this does not address at all, but might be the "killer purpose" of such a display, is to allow COMPARISONS between rows, or between columns. I have to admit, I'm not too sure about the animation of expanding and collapsing the data. It's pretty awesome that you were able to have it be interactive within the time that you had, but for some reason i'm not sure it is the most appropriate for this particular type of data. Also, comparing the relationships a bit clearer between the different logins would be nicer. The animation on hover is awesome. ** agreed. I like how it minimizes the other, non-moused over information. I think this is a really interesting idea and topic to explore. From the video at least, its a little hard to see the topics labeled. Maybe there's a different way to format it that would solve that? Maybe something that shows these (possibly) unusual links more directly? ** Agree! I wonder if the column's width has some kind of meaning, as it affects the visual representatipn. I think what you said about being able to filter the data is key. I'm sure there are some very interesting insights here but they might be sort of washed out by the sheer volume of uninteresting data.