SankalpBhatnagar-FinalProject-StrokeWeight
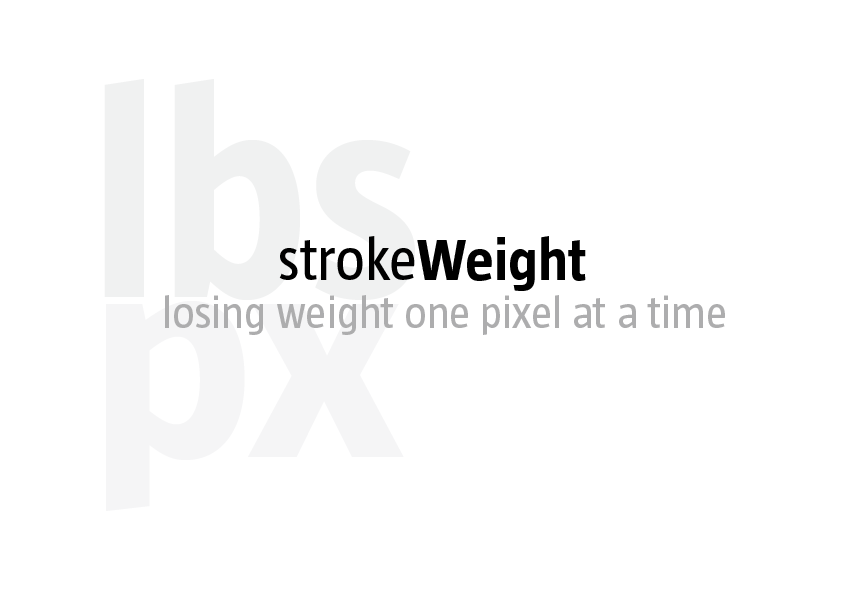
strokeWeight
A data visualization meant to display weight loss through a new perspective. Meant to merge my personal health with my vision of effective design. The goal was to visualize my own weight loss in a meaningful and unique way. The result was typographical motivation to lose weight, one pixel at a time.
Here is the official video, developed to demonstrate the data visualization:
[youtube http://www.youtube.com/watch?v=gX9yQBNqtpQ&w=560&h=315]
How’d I come up with this?
For the last 15 years, I have been overweight. In December of 2011, I peaked at 314 lbs. As a college student, my weight limited my involvement on campus and in my community; as a boyfriend, my weight put various strains on my relationship with my girlfriend; and as a guy, my weight was causing unforeseen health problems in my personal life ranging from exercise asthma to more serious health complications. So in January of 2012, I decided to change my life around. My girlfriend at the time was starting her semester abroad in France and I knew this semester would be the best semester for me to really focus on achieving this goal.
As a big guy, one of the first thing you find when you scour the web for tips and tricks on how best get motivated are what I call thinspiration photos. These usually consist of people’s before and after shots, most of which are not just comparisons and some of which are just outlandishly fake. However, what I noticed was that regardless of how many photos I saw, I never really felt compelled to keep on a diet. Furthermore, I never really felt that the slower, week-by-week progress points were properly documented. Because of that, I didn’t think it was very worthwhile only depending on photos of my body.
In my work with communication design, I primarily used tools like Illustrator to help me adjust typography. So recently, I was interested in visualizing information through just typography. I wondered if it was possible to develop inspirational typography to help me assess the progression in my weight loss initiative through a well-documented visual analysis.
First Attempt(s)
At first, when I thought of the basic concept for this, I actually wanted to change other aspects of typography. Originally, I planned on changing the kerning (or space) between the letters in my name based on my monthly BMI. However, I felt that the spacing between letters would not be the best part of the word to change since it may appear too obscure for the audience to recognize any major shift in BMI. Then I thought about changing the size of my name based on my weight, but quickly decided that would likely get out of hand and would portray my name at too large of an initial size to be accurately compared to the size of what my name should be at an ideal weight.
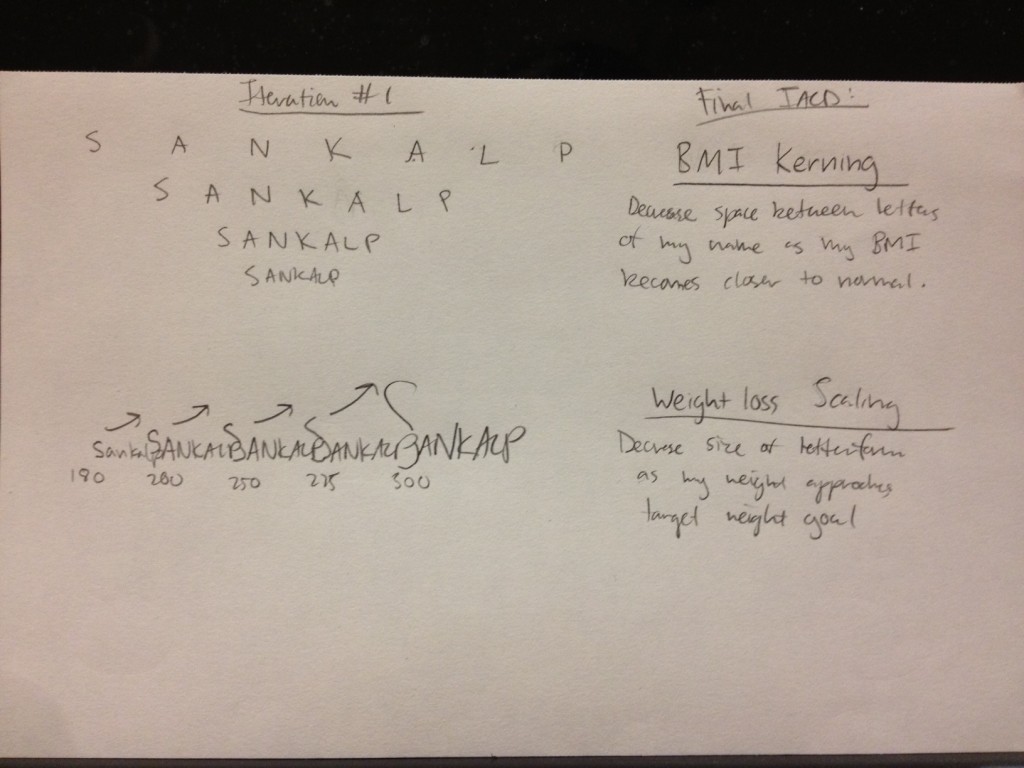
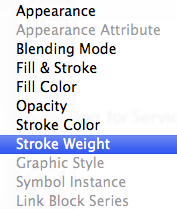
Eventually, I decided to go with the stroke of my name. For every pound I lost, my name would be displayed in a less thick, or obese, stroke. This would ensure the legible spacing of the letter and also minimize any unnecessary obscurity from my project. It was the best of both worlds, in terms of demonstrating my weight loss—and it even sounded great too. I mean, losing weight to decrease strokeweight is pretty catchy.
After getting through the initial concept, I took to my notepad and began drafting the idea further:
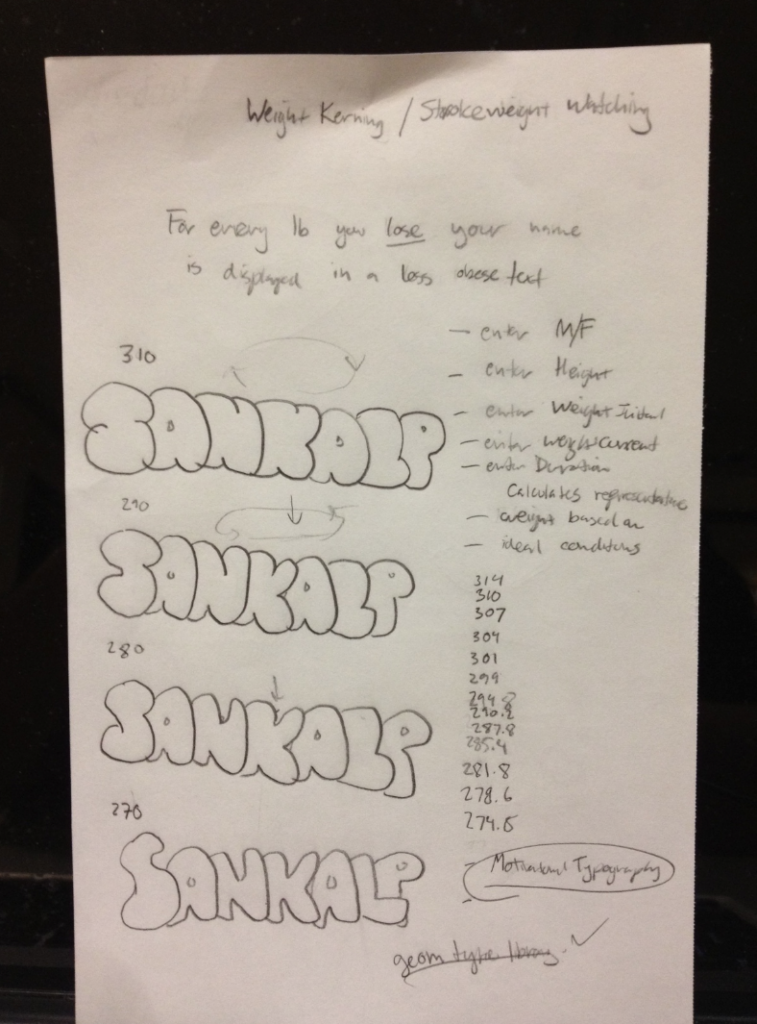
Originally, I just wanted the letterform to morph from thick to thin and keep repeating, so the user could keep in mind how much weight I lost. However, that ended up appearing very confusing and after I met with group in one of the class sessions, I was told to make the piece more understandable. Mainly, I was tasked with trying to effectively demonstrate my weight loss, without making the program look like I was just cycling though the thick and thin versions of my name.
Fellow designer Luci told me that I should aim to demonstrate the data through chronology. That I should aim to visualize the evolution of the letterform, not just the changing of strokeweight. I agreed and began to iterate a few ideas:
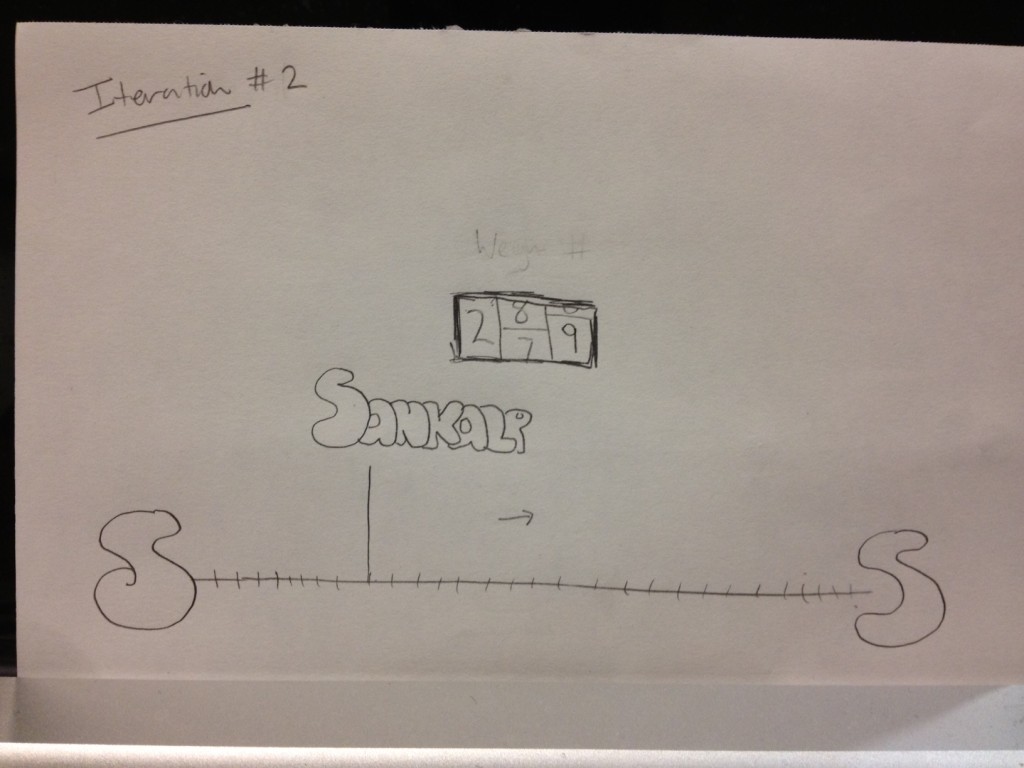
I thought of including a timeline at the bottom of the window that my name’s letterform was attached to that could move right across as I lost more weight and approached a thinner letterform. This could be complimented by a lottery-styled weight-tracker that would display my actual weight. Up until then, I had not planned on including my weight numbers, partly because I didn’t think it was necessary and partly because the data is very personal. Originally, I thought it’d be cool to have a lottery-spin style number visualization. Ultimately, I scrapped this idea, but I decided to display actual numbers in the window in a more simple fashion.
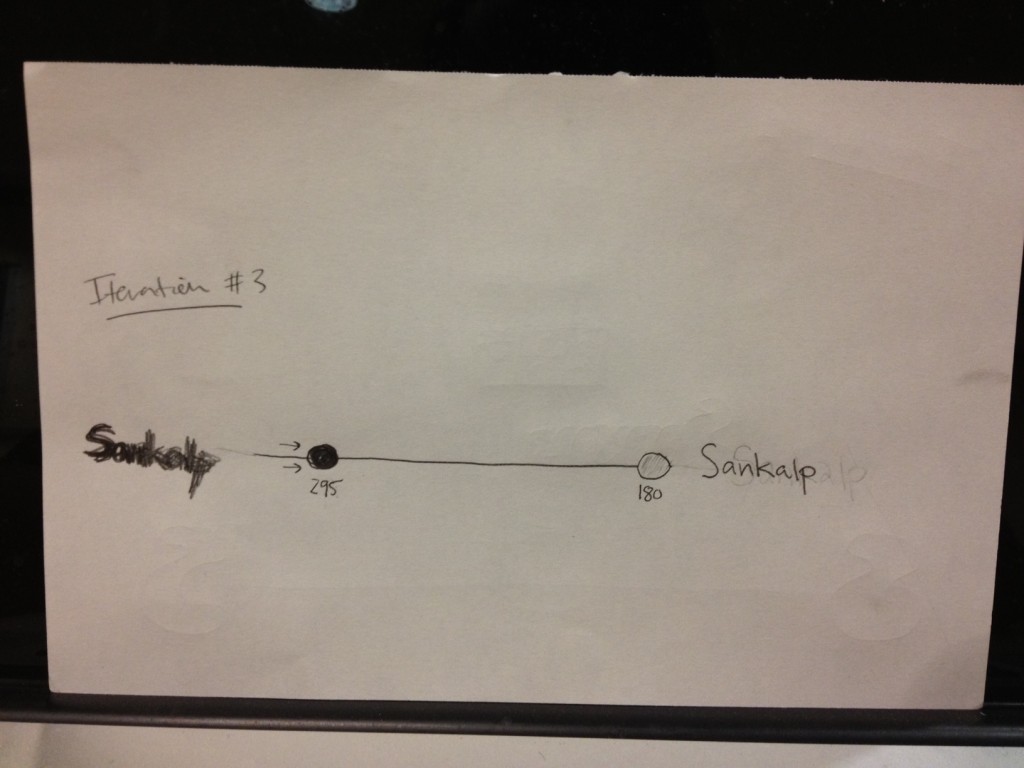
Next, I began thinking about how best to show progress in this timeline I wanted to include.How could I make an effective timeline? Below is a sketch from that iteration where I started to link circle icons to different positions along the weight-loss path. For instance, the dark circle would match a thicker representation of my name, and the lighter circle could represent the healthier, target representation of my name. This idea led to add something major to my work. I took these colored circle icons as a sort of instruction for the audience to put together and understand. If I could place them along this timeline in a way that hinted at what I wanted to be at, I believe I’d be able to successfully add motivation to the piece. Something it lacked before, and could definitely benefit from. After all, I believe that allowing an audience to feel a connection with a design work is one of the most essential things to effective design. If the audience could realize themselves what I was doing, with no instructions, just a moving dot, a progressively thinner letterform, and a subtle hint at my goal, I feel that I’d earn their appreciation.
Any kinks?
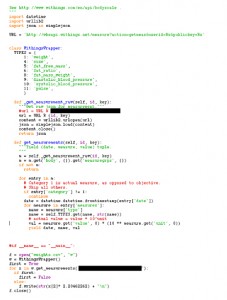
One of the biggest issues with this project was getting the API to work. Not because working with API’s is necessarily difficulty, but because the Withings API wasn’t exactly the best API to work with, not to mention I could only find a python wrapper for the Withings API—and I didn’t know Python.
Yeah, so I had to learn in the span of a few days, how to do basic programming in Python. It wasn’t pretty, but it got the job done. Took longer than I thought, but I feel that it made me a better programmer. I mean, working in a language you don’t know is one thing, but learning that language for the first time and then trying to work in it is another thing entirely.
However, I’m proud to say that I got that little kink straightened out and proceeded to use Processing, the only language I’m truly familiar with and have worked with all semster. I had to use a few new functions in the Processing library including functions that loaded text files, parsed them, and then used those points as an array to hinge my letterforms on. It was overwhelming at times, but I believe I was able to get through it, and get my code working properly.
How was it built?
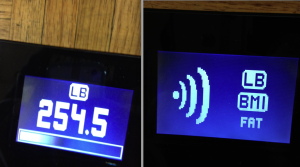
I purchased a Withings WiFi body scale that allowed me to upload my weekly weigh-ins to a user-account site. I then wrote my first python script that utilized the online Withings API to scrape the data into a text file. I used Processing to load the values from this text file and visually display the information with the help of the Geomerative Library.
What now?
Throughout the development of strokeWeight, I ran into a few issues, however these were mainly due to my lack of programming knowledge. In the future, I plan implement strokeWeight in a more interactive way. This project serves as the foundation on which I plan to design more health related programs. I actually plan on transitioning strokeWeight into an actual app that could display the data visualization on my mobile devices.
Currently the project is limited by the lack of real-time interaction. Because of the nature of the device, the current user must weigh themselves, wait for it to upload to the site, run the python script, and then run the processing application to display the visualization. I would like to program this project in such a way that the process is more streamline. I believe it is possible and I plan to work with this project to develop the appropriate system that allows the user to step on the scale and within moments see their current stats placed upon the weight axis. I feel this would add a great layer of audience interaction to the program. To do this, I will likely have to reprogram the scale or perhaps even implement an arduino.
Also, I plan to expand the capability of strokeWeight so that the user can enter their own name, and personalize their data visualization with different themes or varying personal preferences. I believe this would provide the most effective inspiration to others who wanted to use strokeWeight to motivate themselves, but wanted to tailor their experience with the program to their own needs.
Luckily, my time and work on this project in Interactive Art & Computational Design for the last month and a half has made me confident in my abilities to continue to iterate and develop this program until it is truly revolutionary. I learned how to do so many things through this project, including how to further scrape an API for data; I learned how to write a working python script for the first time in my life, and I learned how to deal with a few new functions and tools within Processing. All in all, through all of my projects this semester, I am most proud of this one. It definitely pushed my limits both mentally and physically, and I feel like that was the only way I could get something truly inspirational out of this. In my mind, the project is a success because it demonstrates my own ability to develop, code, and design an effective visualization for something extremely personal to me. I currently weigh 252 lbs (down from 314 lbs) and I plan on using strokeWeight to demonstrate any further weight loss to my friends, family, and faculty.
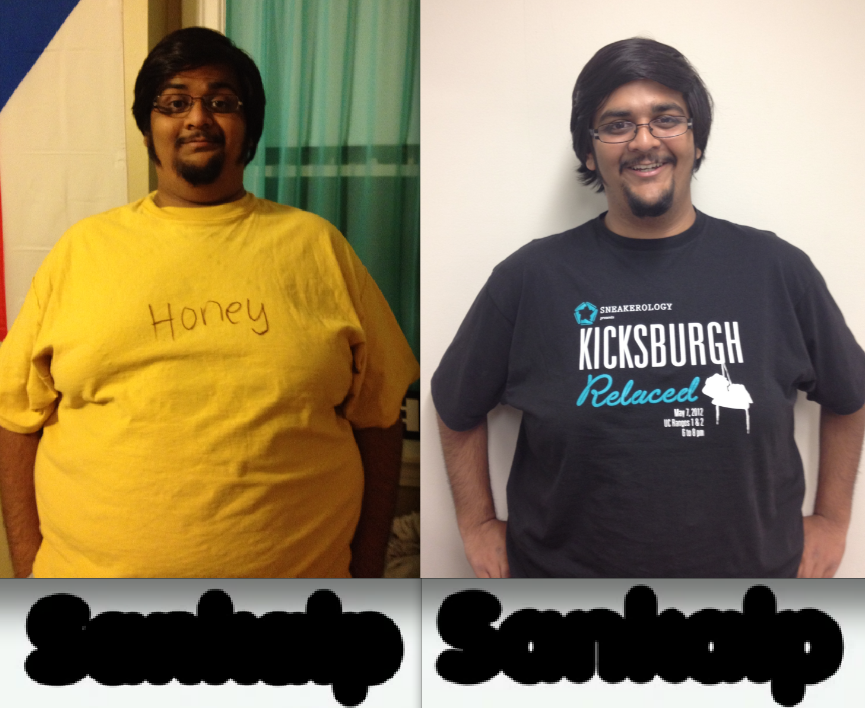
Oh and for good measure, while I believe strokeWeight is typographically successful, here is a before and after photo of my weight loss so far, if you were curious. (On the left, in a 3XL shirt and on the right, in a 2XL shirt)