1) Meng’s Pepper’s Ghost project
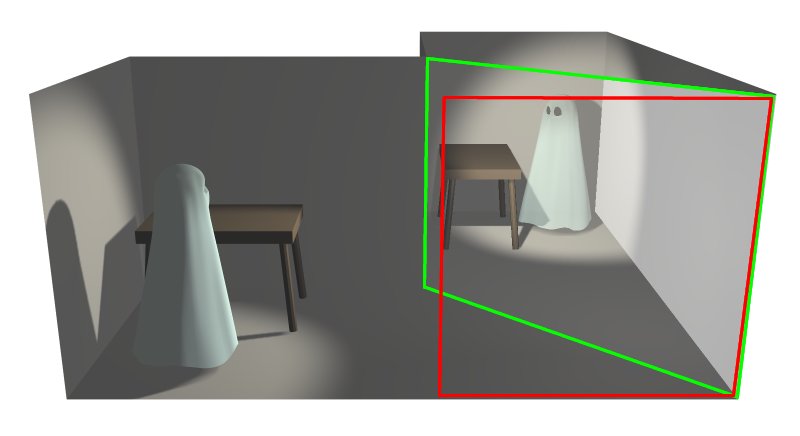
Meng’s interaction project was what originally got me thinking about my capstone. Her work involved visualizing different maps in three dimensions using a small Pepper’s Ghost apparatus. The Pepper’s Ghost illusion works by projecting an image onto an angled piece of glass, which causes it to appear to float in space. Meng’s map layers and images could be viewed simultaneously by changing one’s viewing angle. I like the idea of being able to peer around layers and data to see what lies beneath or behind it, and I would like to incorporate this idea into my capstone. I think that the Pepper’s Ghost apparatus may not be the best suited tool for this, though, and I hope to find a way of interacting with layered data on a two-dimensional screen.
2) GigaPan Time Machine and Solar Dynamics Observatory

Time Machine is a project out of the CREATE Lab that allows users to view and create zoomable time-lapse videos. Similar to the GigaPan project, very high resolution interactions are made possible on even modest internet connections because of smart fetching of tiled data. The project has created time-lapse videos from photos of plants growing to data from the Landsat and Modus satellites and images of the sun from the Solar Dynamics Observatory. I’m particularly entranced by the time lapse of the sun. It’s amazing to see solar flares that dance across the surface of the sun and arc over spaces large enough to fit several earths inside. It’s also possible to explore images of the sun taken from different wavelengths, allowing for visualizations of not only visible light, but also the infrared and ultraviolet spectra and the magnetosphere. Unfortunately switching between these fixed spectra is the only digital interaction in Time Machine (meaning that only one frequency can be viewed at a time), which means that it is hard to draw connections between activity at one frequency versus another, even though the behavior varies wildly. I would like to create a way of viewing multiple layers at once, either combined or displayed separately but in a way which allows a viewer to see events in at least two different frequencies at once.
3) Panamap
This company uses a patented process to create physical maps that change the information they show depending on the angle at which they are viewed. Three different layers can be seen on a single map. My understanding of the technology is that it is very similar to the little plastic animated cards that show simple movements (such as a dinosaur walking) when the card is tilted back and forth. What’s interesting to me about this project is that it suggests one method of interaction to view a multi-layered map (tilting up and down). I want to think about similar ways to manipulate and view layers, especially digital ones on either a fixed screen or a tablet. Again, there might be an idea here which could help me visualize multiple frequencies of sun imagery.
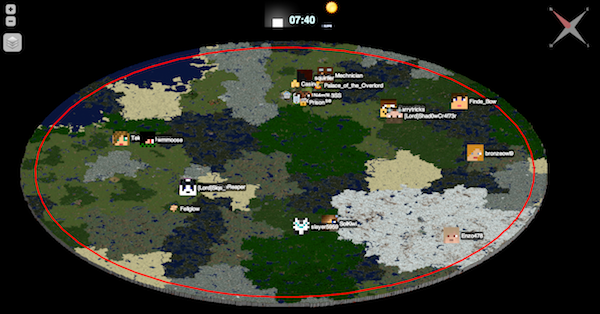
Of course I had to post at least one thing about Minecraft. This site shows a dynamically-updated view of a fairly well-populated Minecraft server map, including day/night lighting and player positions. The map is zoomable to a fairly extreme degree, which lets the user find and discover all of the various buildings and settlements that different groups of players have formed over time. Some of them seem abandoned, while others are almost always occupied. Maps of Minecraft worlds aren’t particularly unique, but the fluid way in which this one is explorable and the fact that it updates itself constantly is new to me. I would like to incorporate the ability to stream fresh data into my final project in some capacity.