Hello.
I’m Brandon, a second year phd student in HCI. I studied film and electrical engineering at the University of Texas at Austin as an undergrad and have a master’s from the MIT Media Lab. Before coming to CMU I worked at Samsung in Korea for a few years.
Most of my work has been focused towards the hardware end of things (custom sensors, hardware design, gesture recognition) but there is usually a software side (even if it’s just try and see why the hardware isn’t working right). At Samsung I worked on gesture recognition for the TV platform. Samsung is not big on openness so I don’t have much to show from my work there.
For my master’s thesis, I developed a grasp-recognition system called Graspables. It used custom capacitive sensor arrays to detect how someone holds an object and use that as a means of interaction. I was going to talk about this project, but it’s not really representative of what I am hoping to do in this course. Instead I’ll post about the Ionosphere.
When I was an undergrad, I got a internship at the Applied Research Laboratories working with scientists who studied and modeled the Ionosphere. I had no particular interest in high atmosphere physics, but I needed money and a things to put on a resume, so study the Ionosphere I did.
Ultimately, the goal was to produce models of the Ionosphere which would work like weather prediction models to correct GPS errors introduced when the signals passed through the Ionosphere. To this end, I was tasked with cleaning up satellite data sets and running various analyses on them. These data sets consisted of hundreds of millions of data points collected continuously by several satellites over a span of years.
Using a terrible combination of fortran, perl scripts, matlab and C code, I spent the next 2+ years trying to detect events that were of interest to the Ionospheric science community. A sudden increase in electron density (see below) during a satellite’s pass could indicate a weather event worth studying.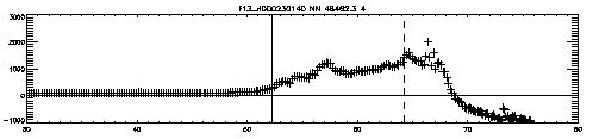
A Segment of Electron Density Measurement by Satellite Latitude
As I worked, the plots I developed became more complex. Events could be better visualized and explained. The map below was automatically generated by an algorithm searching decades of data for narrow bands of elevated electron density associated with storms.
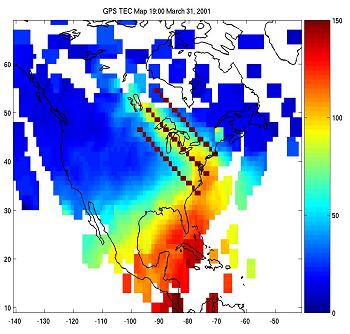
Detection of a Storm Enhanced Density Plume
Ultimately, I graduated from UT and moved on, but whenever the subject of big data or visualizations come up, I’m reminded of my brief tenure in Ionospheric science. The problem that was holding back understanding of the Ionosphere wasn’t a physics problem, it was a problem of finding the relevant data.
Ever since then, I’ve been particularly interested in trying to apply techniques across fields. I’m hoping that this course will give me the chance to explore new things that may turn out to be useful in some unexpected way down the road.