In my data visualization assignment I would like to analyse buildings around the world from the perspective of an objective “aesthetic” criteria. More specifically, the idea is to isolate the geometry of the building from its context and materiality and consider only an abstract geometrical quality. At first I thought that I could access Google database of buildings footprints that they developed with computer vision, but it seems to be very restricted. Then I discovered openstreetmap, that is a colaborative map platform that provides all the nodes, ways and provides these footprints . It is possible to access their data from an osm file of some area or with the Osmapi api that allows specific investigations of the elements. These maps are composed by nodes, ways, relations and tags . In this representation, a footprint of a building is a way that connects the building edges and contains a tag like these : <tag k=”building” v=”school”/> .
Basically, I will collect the larger data base I can and then I will analyse each building in relation to its axial symmetry. Polygons with many points mirrored along many axis will be considered successful and will be ranked in this footprint competition. For that I will need an algorithm capable of evaluating 2d axial symmetry and also a scoring system (that is the next step).
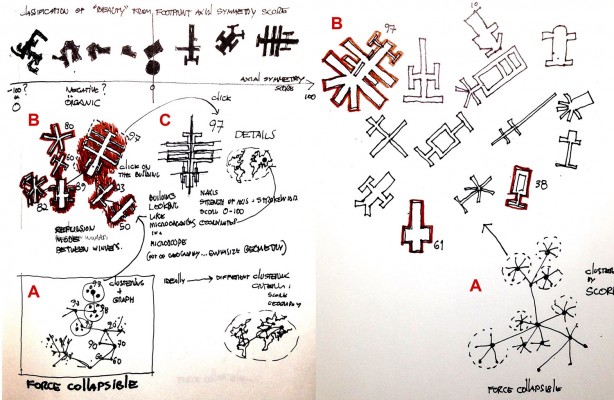
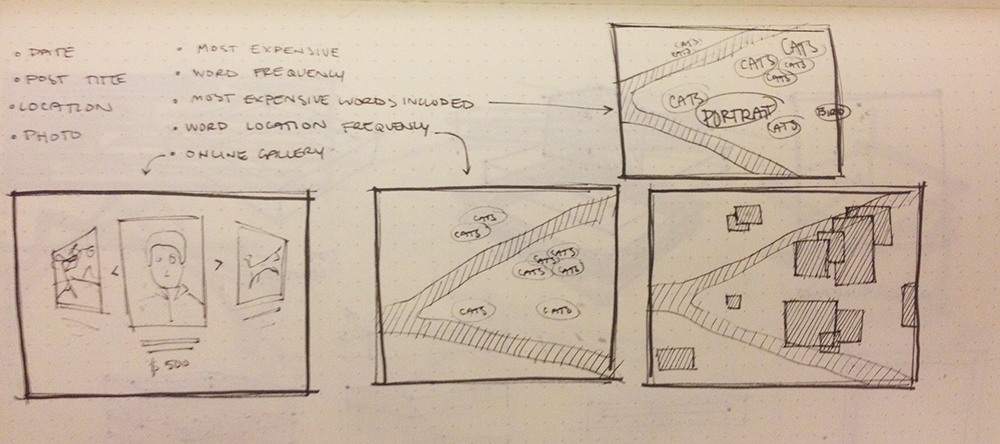
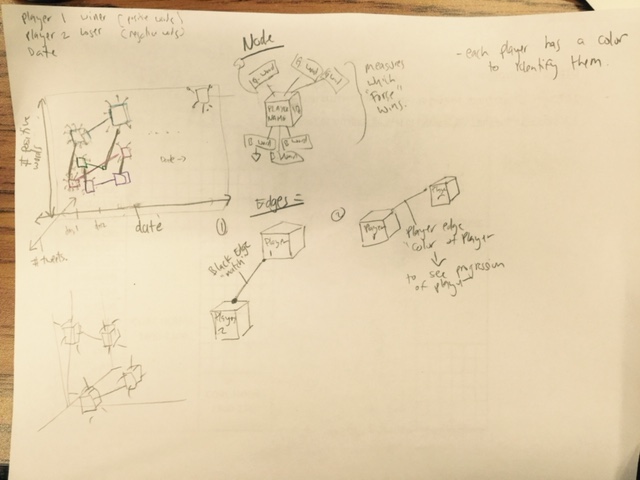
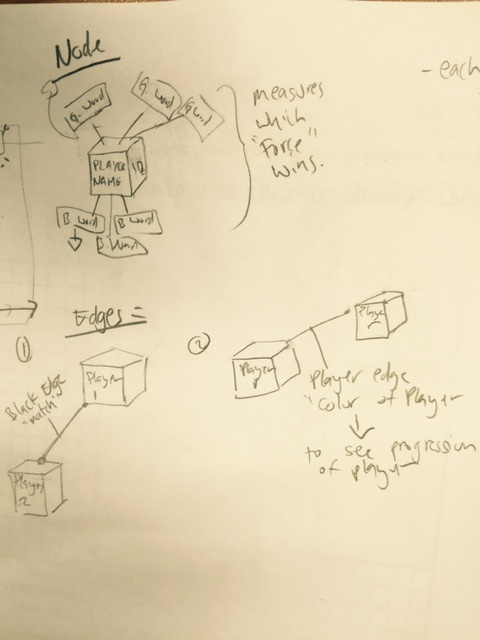
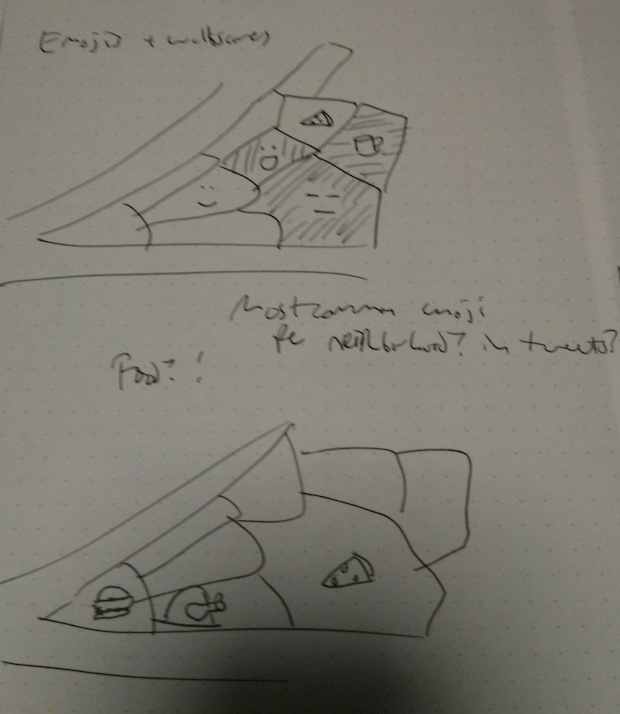
To represent this ranking, I will define three basic representations. At first, there is a Collapsible Force Layout (A), with the triumphant buildings represented . This will be a graph containing a reference to the buildings. After selecting a cluster, the user goes to a screen in which the footprints are represented as floating agents (B), with a repulsion force proportional to its ranking. Out of their geographical context, these footprints will look like micro-organisms under a microscopes and when the user clicks one of these agents, it shows more informations (C), as its score, axis, coordinates, city, etc.
Below is a basic sample of way elements:
{u'changeset': 16367172, u'uid': 1281932, u'timestamp': datetime.datetime(2013, 5, 31, 16, 9, 43), u'nd': [274546, 444792922, 444792923, 444792924, 274547, 444792925, 444792926, 444792927, 274549, 444792928, 444792929, 444792930, 274545, 444792931, 444792932, 444792933, 444792934, 274546], u'tag': {u'ref': u'FFB 11', u'zone:traffic': u'DE:urban', u'junction': u'roundabout', u'highway': u'tertiary'}, u'visible': True, u'version': 11, u'user': u'marcoSt', u'id': 99}
{u'changeset': 24122050, u'uid': 2675, u'timestamp': datetime.datetime(2014, 7, 13, 14, 56, 25), u'nd': [260904, 456386831, 260897, 456386832, 260898, 456386833, 185986175, 456386834, 260899, 456386835, 260900, 456386836, 260901, 456386837, 260902, 456386838, 1807516891, 260903, 456386839, 260904], u'tag': {u'maxspeed': u'100', u'junction': u'roundabout', u'zone:traffic': u'DE:rural', u'tmc': u'DE:32282/32283', u'oneway': u'yes', u'ref': u'St 2069', u'highway': u'secondary'}, u'visible': True, u'version': 11, u'user': u'Eckhart W\xf6rner', u'id': 100}
{u'changeset': 4742828, u'uid': 214906, u'timestamp': datetime.datetime(2010, 5, 18, 20, 44, 21), u'nd': [738930419, 738930433, 738930434, 738930436, 539318, 539319, 539320, 442784], u'tag': {u'postal_code': u'01217', u'name': u'Altmockritz', u'highway': u'residential'}, u'visible': True, u'version': 3, u'user': u'stipriaan', u'id': 103}
{u'changeset': 18557067, u'uid': 1233651, u'timestamp': datetime.datetime(2013, 10, 26, 19, 59, 13), u'nd': [534596, 2500054645L, 2500054622L, 312748152, 436616236, 437511619, 534603, 437511609, 534604, 259148818, 2509702677L, 442762], u'tag': {u'maxspeed': u'50', u'incline': u'up', u'hazmat:backward': u'no', u'source:maxspeed': u'DE:urban', u'surface': u'asphalt', u'zone:traffic': u'DE:urban', u'postal_code': u'01217', u'smoothness': u'excellent', u'highway': u'unclassified', u'name': u'M\xfcnzmeisterstra\xdfe'}, u'visible': True, u'version': 23, u'user': u'NESDD', u'id': 104}
{u'changeset': 17497537, u'uid': 86504, u'timestamp': datetime.datetime(2013, 8, 25, 11, 27, 49), u'nd': [442743, 2271977168L, 442742, 2429181320L, 442741, 1839778041, 442734, 442745, 442744, 442746], u'tag': {u'name': u'Altpestitz', u'maxweight': u'3.5', u'surface': u'cobblestone', u'postal_code': u'01217', u'maxweight:destination': u'none', u'highway': u'residential'}, u'visible': True, u'version': 8, u'user': u'Thomas8122', u'id': 105}
{u'changeset': 8681961, u'uid': 3112, u'timestamp': datetime.datetime(2011, 7, 10, 10, 26, 31), u'nd': [442757, 1356245842, 1356245836], u'tag': {u'maxspeed': u'30', u'name': u'Meraner Stra\xdfe', u'highway': u'residential', u'oneway': u'yes'}, u'visible': True, u'version': 3, u'user': u'HDietze', u'id': 106}
{u'changeset': 4563292, u'uid': 277315, u'timestamp': datetime.datetime(2010, 4, 30, 5, 48, 59), u'nd': [264671000, 308150257], u'tag': {u'maxspeed': u'30', u'postal_code': u'01217', u'name': u'Trienter Stra\xdfe', u'highway': u'residential'}, u'visible': True, u'version': 7, u'user': u'ixx#xx7s6', u'id': 107}
{u'changeset': 805472, u'uid': 42123, u'timestamp': datetime.datetime(2008, 11, 28, 12, 57, 49), u'nd': [442752, 231712390, 442754], u'tag': {u'postal_code': u'01217', u'highway': u'living_street', u'created_by': u'Potlatch 0.8', u'name': u'Kitzb\xfchler Stra\xdfe'}, u'visible': True, u'version': 5, u'user': u'Ropino', u'id': 108}
{u'changeset': 17469918, u'uid': 86504, u'timestamp': datetime.datetime(2013, 8, 23, 13, 25, 50), u'nd': [264570797, 308150265, 248908215, 1420907, 442754, 2429178444L, 1420910], u'tag': {u'name': u'Tirmannstra\xdfe', u'maxweight': u'3.5', u'postal_code': u'01217', u'oneway': u'yes', u'maxweight:destination': u'none', u'highway': u'residential'}, u'visible': True, u'version': 8, u'user': u'Thomas8122', u'id': 109}
{u'changeset': 20812379, u'uid': 97529, u'timestamp': datetime.datetime(2014, 2, 27, 16, 58, 20), u'nd': [534622, 365507695, 1128425638, 440685648, 440685642, 440685646, 440685644, 293298196, 2692936392L, 440685659, 30849663, 308247825, 440691774, 308247823, 534620, 308247821, 308247819, 311067041, 534619, 311723849, 267039526, 556089111, 534618, 312542724, 556089114, 267039527, 312542730, 534596], u'tag': {u'lit': u'yes', u'surface': u'concrete:plates', u'name': u'Heinrich-Greif-Stra\xdfe', u'highway': u'residential', u'smoothness': u'intermediate'}, u'visible': True, u'version': 19, u'user': u'burts', u'id': 110}
{u'changeset': 27307248, u'uid': 86504, u'timestamp': datetime.datetime(2014, 12, 7, 9, 52, 24), u'nd': [534606, 2292709317L, 1283184340, 2951208877L, 2292709316L, 2951208921L, 293299139, 440691761, 367842901, 30849657, 30849656, 440685590, 245943684, 440685588, 98009295], u'tag': {u'maxspeed': u'50', u'name': u'Paradiesstra\xdfe', u'source:maxspeed': u'DE:urban', u'lit': u'yes', u'zone:traffic': u'DE:urban', u'postal_code': u'01217', u'sidewalk': u'both', u'highway': u'unclassified'}, u'visible': True, u'version': 28, u'user': u'Thomas8122', u'id': 111}
{u'changeset': 26892147, u'uid': 118134, u'timestamp': datetime.datetime(2014, 11, 19, 18, 11, 54), u'nd': [534591, 1724840807, 310611518], u'tag': {u'maxspeed': u'50', u'lanes:backward': u'2', u'name': u'R\xe4cknitzh\xf6he', u'hgv': u'destination', u'source:maxspeed': u'DE:urban', u'surface': u'asphalt', u'cycleway': u'lane', u'zone:traffic': u'DE:urban', u'turn:lanes:backward': u'left|through', u'lanes': u'3', u'smoothness': u'good', u'highway': u'residential'}, u'visible': True, u'version': 15, u'user': u'scai', u'id': 112}
{u'changeset': 21342398, u'uid': 97529, u'timestamp': datetime.datetime(2014, 3, 27, 11, 6, 25), u'nd': [534595, 2747198226L, 2132669977, 534602, 534597, 267028214, 534598, 267028211, 534599, 267028213, 534600, 267028212, 534601, 330439848, 1274535018, 267028210], u'tag': {u'bicycle': u'no', u'incline': u'up', u'surface': u'cobblestone', u'lit': u'yes', u'width': u'2.5', u'foot': u'designated', u'highway': u'footway', u'name': u'Moreauweg'}, u'visible': True, u'version': 9, u'user': u'burts', u'id': 113}
{u'changeset': 20463221, u'uid': 120153, u'timestamp': datetime.datetime(2014, 2, 9, 11, 44, 9), u'nd': [534588, 248908341, 248908338, 348200903, 2663027377L, 2069973, 264671000], u'tag': {u'maxspeed': u'30', u'name': u'Ludwig-Renn-Allee', u'surface': u'asphalt', u'lit': u'yes', u'zone:maxspeed': u'DE:30', u'highway': u'residential'}, u'visible': True, u'version': 11, u'user': u'ulmtuelp', u'id': 114}
{u'changeset': 20463221, u'uid': 120153, u'timestamp': datetime.datetime(2014, 2, 9, 11, 44, 7), u'nd': [2069973, 2576312785L, 2455344215L, 2455344219L, 267029728, 2313416990L, 2455344221L, 534644, 2455344210L, 2663027380L, 534643, 534642, 534641, 2285697890L, 417219076, 534588], u'tag': {u'lit': u'yes', u'maxspeed': u'30', u'name': u'Bulgakowstra\xdfe', u'highway': u'residential'}, u'visible': True, u'version': 14, u'user': u'ulmtuelp', u'id': 115}
{u'changeset': 13857826, u'uid': 120153, u'timestamp': datetime.datetime(2012, 11, 13, 10, 48, 4), u'nd': [442756, 313902426, 442765, 442766, 97008303, 442767, 97008308, 442768, 2012203417, 442769], u'tag': {u'maxspeed': u'30', u'name': u'Kaitzer Weinberg', u'highway': u'residential'}, u'visible': True, u'version': 6, u'user': u'ulmtuelp', u'id': 116}