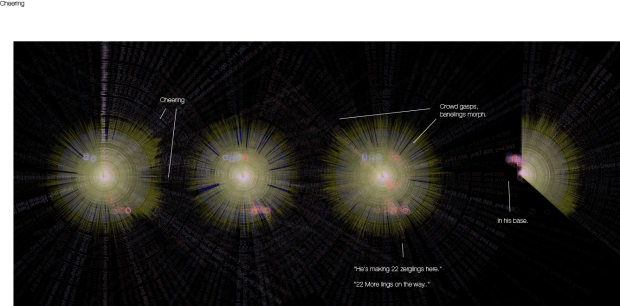
Visualizations of the audio and replay files from finals of the WCS 2014 Starcraft Tournament. This is intended to be a celebratory piece of starcraft e-sport, rather than a technical analysis.
Here is the rendering process (note the audio gap due to applause at the end of video)
Please view the full size version:
The yellow is an audio visualization of the sound clip I pulled off youtube from the official broadcast. The rest of the info was extracted from the replay file from the WCS website. The red and blue blurs are where the players’ camera are focused on relative to the minimap. The text lines are actions that have been taken during those times, matched with the seconds. There is however sometimes problems with the audio and the data files syncing in time, but its usually not over 10 seconds. I annotated the images with some interesting aspects and/or comments about the game.
The reason why I made this clip is due to celebrate the passion and emotions that occur in starcraft. There have been other visualizations of sc2 replays, however they have all been technical. There was a moment in time when I watched day 9’s video about his sc2 life. Before that moment I did not think about esport as something so emotional, since I viewed games as entertainment. After hearing his life story about what drove him to be a professional, I gained another perspective on starcraft. Which is that people really really really care about the game, and extreeeeemely pasionate about it. (It has 3.5 million views btw)
It was important to include the audio which included all the cheering and feelings of the audience and caster. The commands are made so that they only apear if they have been clicked on multiple times within a second. (SC2 players have an APM of 300, meaning that they perform 300 actions every minute.) If a single second has an extremely high amount of commands, such as some of the annotated baneling moments, they are actually visible via rendering / stacking.
The reason I chose spheres rather than a linear bar graph was that I wanted to move away from analysis, and focus more on the feeling of the game. Showing moments when players panic and increase their APM, or showing the mood of the audience and casters from the audio clip. The red and blur blurs show the progress of tension as they overlap views with one latter on in the game.
Here is the video of the game I visualized:
Github (Audio files are not included.)

