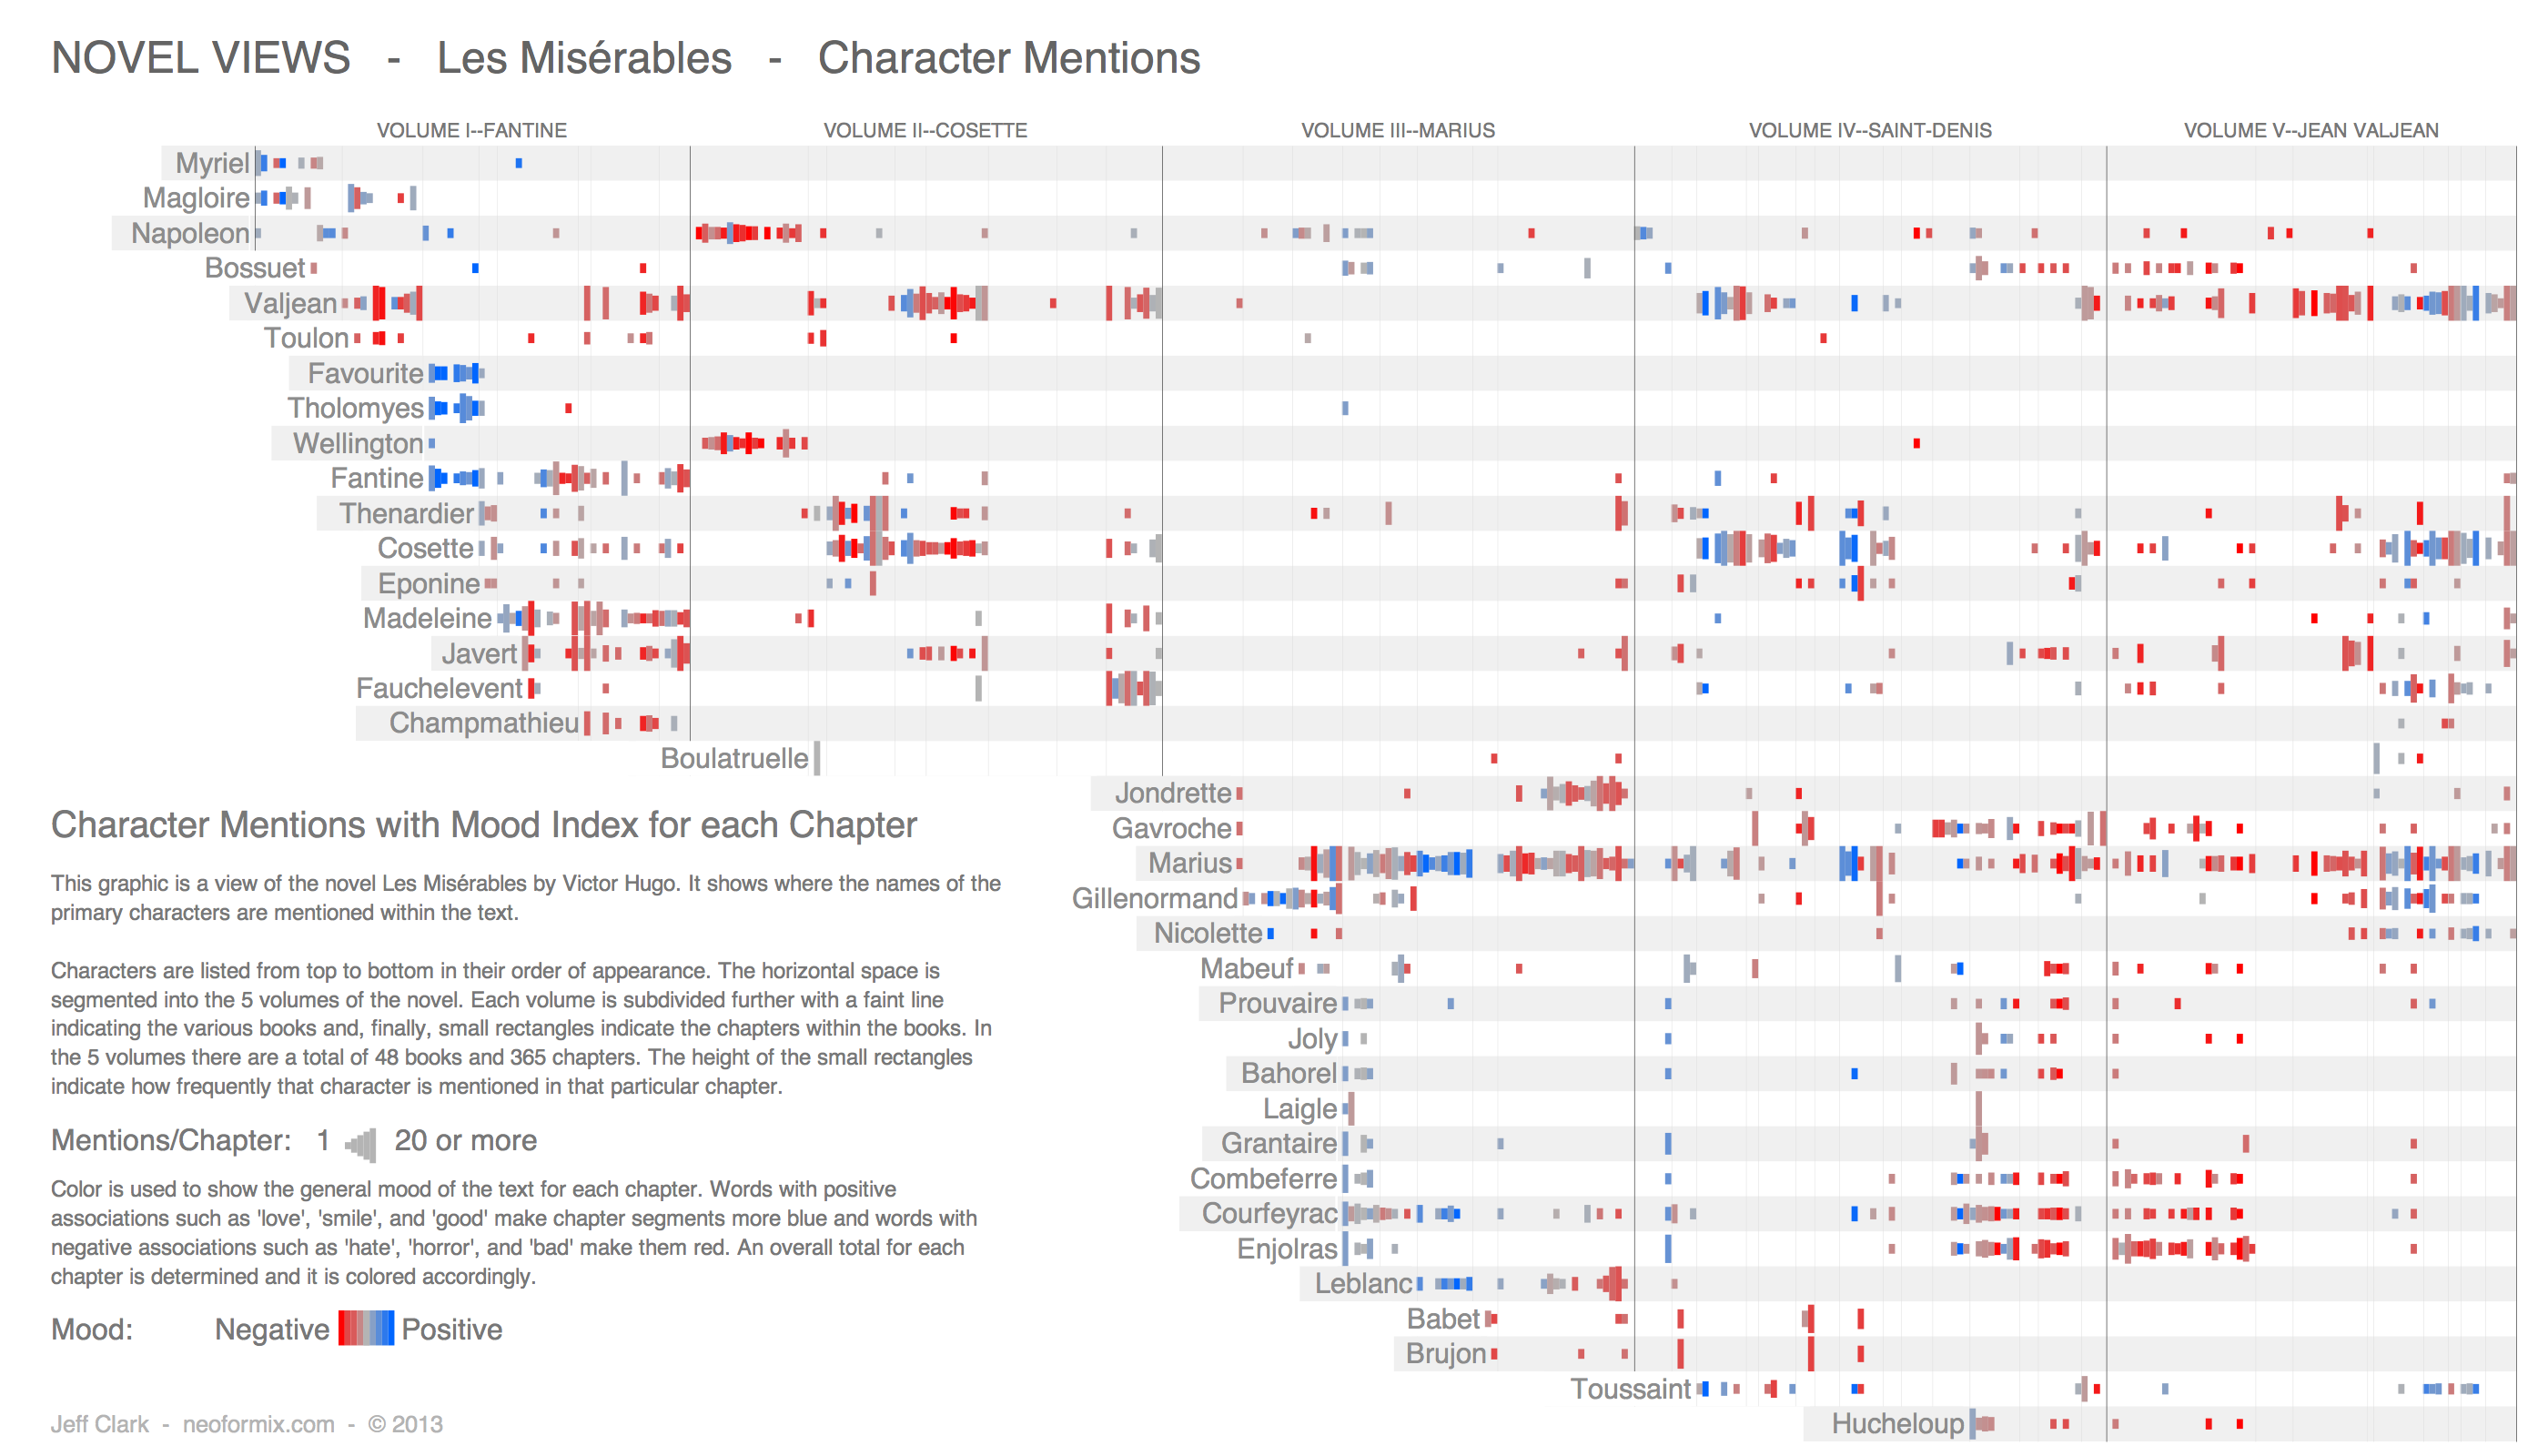
Novel Views is a series of visualizations of “Les Miserables.” Characters are listed in order of appearance from top to bottom. The novel’s volumes span the horizontal space, with subdivisions of books and chapters. The height of the colored rectangles indicate how often that particular character is mentioned in a specific chapter. Additionally, color is used to indicate mood – positive associations are indicated in stronger shades of blue, and negative associations are indicated in stronger shades of red. This is an interesting visualization as it combines the display of a character’s appearance frequency with the emotional context in which he or she appears. I’ve been trying to figure out what to do with the scraped Dilbert transcripts and downloaded comic images for use in my final project, and this view has given me some ideas and inspiration. This visualization is static, and I think it might have been nice to be able to filter specific characters or themes for better visual clarity.
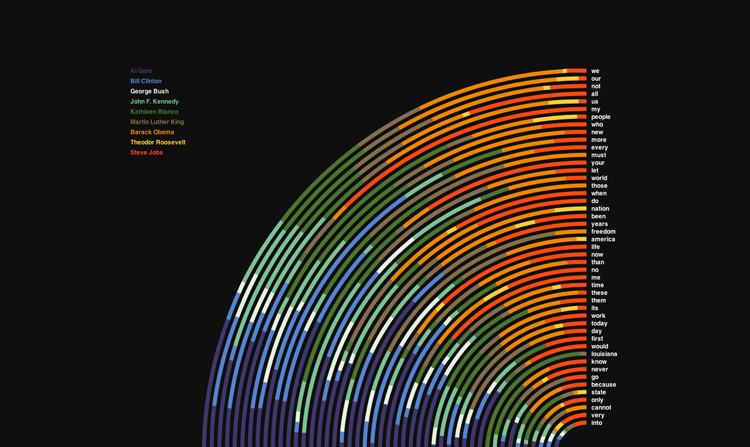
This visualization project analyzes words from nine speeches from notable people and then displays the results in an arc. The words — whose associated arcs are divided by colors linked to a particular speaker — are shown on the right, ordered by the number of times they appear in the speeches’ text. This allows one to see what particular words or topics are common to multiple speakers. I find the presentation style to be a clear and appealing way of illustrating what percentage a word or topic is used by a speaker. The creator indicates that graphis diagram books that visualizes abstract data were a source of influence.