As an introvert who is not particular enthusiastic about mountainous terrain, I was attracted to this Strange Maps article. The article contains the following graph from a study by Oishi, Talhelm and Lee in the Journal of Research in Personality.
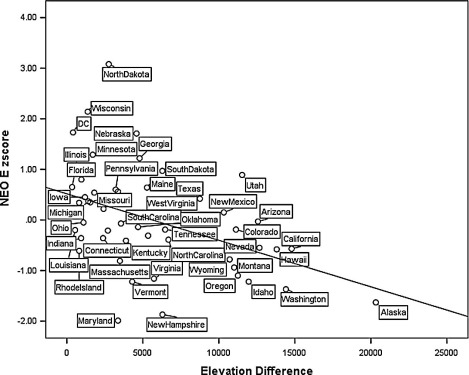
The authors investigate a connection between a preference for mountainous / ocean terrain and degree of extroversion. This map / graph was really interesting in the context of readings on visualizing lack of data, and biases in Data Visualization:
- The cultural bias in visualization is apparent from the introduction in the journal article – “Many cultures have an enduring image of a hermit alone in the woods or mountains apart from others.” I was even more surprised by “When people think about vacations, they often think about ocean vacations or mountain retreats. Thus, it seems appropriate as a first step to examine the link between personality and geography by focusing on mountains relative to the ocean/plains.”
- The graph is plotted based on a study with 921 participants. What about the lack of data? How is a whole state’s extroversion and preference for ocean / mountain visualized for everyone to see based on 921 students?
- The graph displays the elevation difference, but the question people were asked was about preference of oceans / mountains. It is not nearly the same thing and has been misrepresented in the visualization.
It is a pity that an attempt has been made to generalize this small amount of data. Interesting visualizations could have been made with the participants available, while still retaining integrity of visualization.