Looking Foward 2 – Mapping Global Conflict
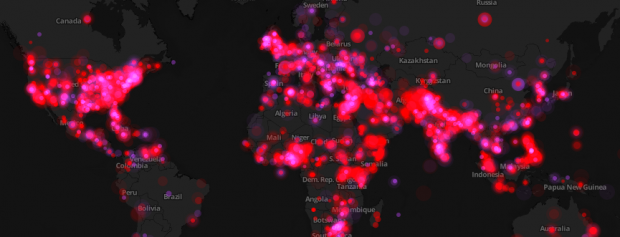
This is a really cool map. It maps out conflict, categorizing it into protests and violence against civilians and plots it on a map over time. Conflict has always been heavily covered by media, but I feel like recently there’s been much more emphasis on conflict especially in the US and middle-east (not too well read on this so don’t quote me). What’s cool about this map is that it collects its data by scraping the web each day for media articles and categorizes the article based on key words and what not. Empirically its a really pretty map; however there are some issues with it. The scraping algorithm seems to be a little bit too inclusive, for example a marine helicopter going missing over Hawaii constitutes as “protests” and conflict within the senate constitutes as “violence”. In addition, these points of data only represent media covered events and completely ignores areas with censored media (check out how desolate North Korea is). Also these frequency points seem to show areas of higher population as more “violent” than areas of lower population so its hard to make any conclusions about a particular area of the world. Either way, it’s a pretty cool map.