Caitlin Boyle :: Looking Outwards :: 4 (infoviz)
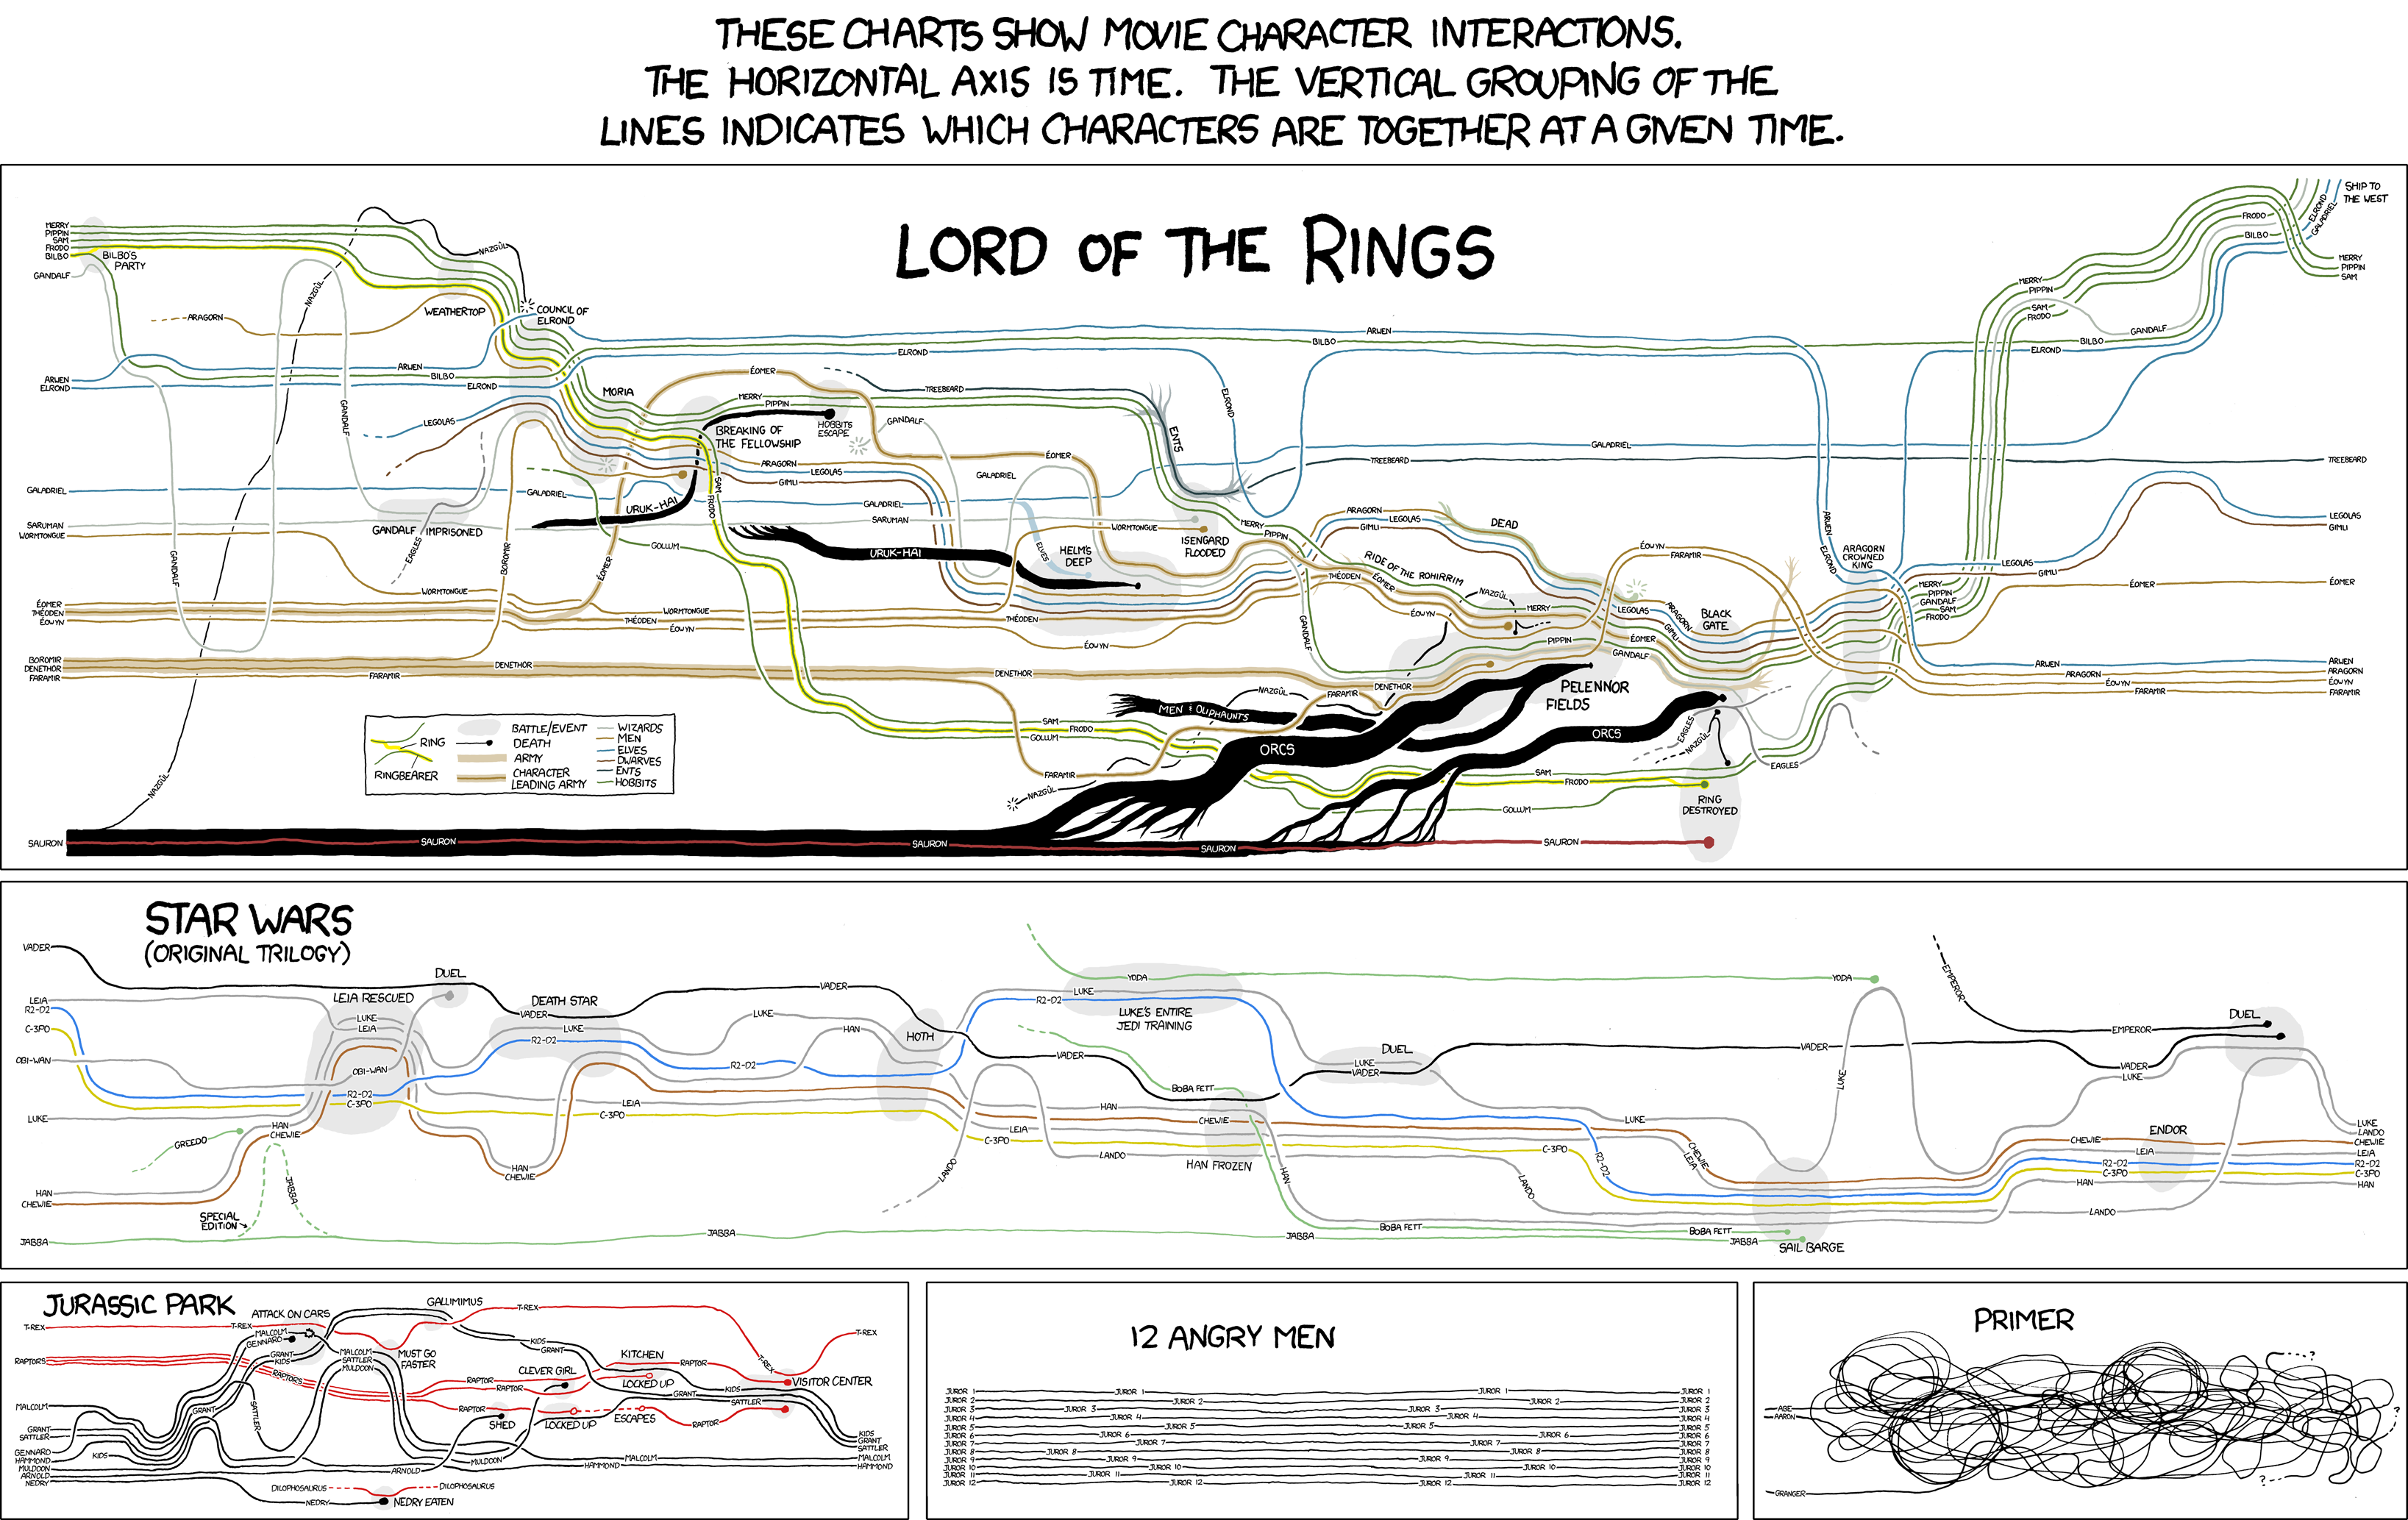
1. ) I’m very attached to these visualizations of movie character interactions from xkcd‘s Randall Munroe; he plots the narrative of a set of movies using only character’s names, and lines representing their movements and interactions with each other. Included are deaths, places of significance, and alliances. The Lord of the Rings trilogy is especially effective, taking Tolkien’s masterpiece and simplifying it down into a series of dots and lines, while remaining legible.

2. ) Nathalie Miebach creates beautiful woven sculptures with data from astronomy, ecology and meteorology data – including parameters like land, sea and ocean temperature, tide readings, moon phases, the solar path in relation to horizon, and the distance between Sun and Earth. I know weather is overdone as a data visualization, but I think these pieces are beautiful; she brings something new to the data by rendering it as a physical piece, almost as if the data has crawled off the page and taken on a life of it’s own.
