John Brieger — Info Vis – Project 2
For my information visualization, I wanted to visualize data in a way that engaged users with data that might be unpleasant. As most information visualizations are clean, crisp representations of facts, I wanted to create an interactive experience that forced users to do something bad or unpleasant in order to see data.

The dataset I chose was deforestation in the Amazon from 1987-2011. Originally, I wanted to have the unpleasant interaction be chopping down trees, but the chopping made too much of a game out of the data, which both trivialized the presentation and sort of made it “fun”. I wanted users to have sacrifice something they held dear to them in order to get more of the data. In my concepting group, we discussed the visualization unfriending people on facebook, a “deforestation” of your social network.

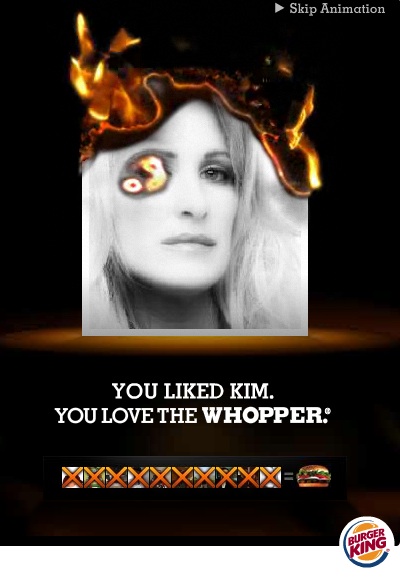
Unfortunately, Burger King pooped on my party. How?
I settled on the idea of mapping area of the rainforest to area of your hard drive, with passive use of your computer “deforesting” more and more of your drive. There is something perverse about the gradual deletion of files, a kind of glee I felt as I zipped my mouse around the screen.
I also added a color indicator as to your impact on your environment (background transitions from green to gray)
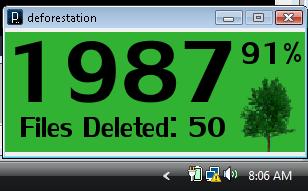
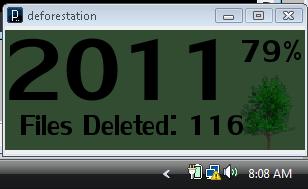
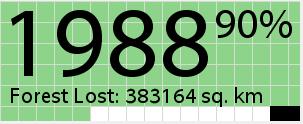
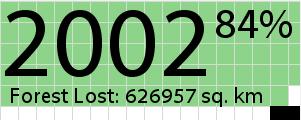
I think we can agree this looks reasonably shitty. So I changed the color scheme a bit, added in a different background info cue (with blocks of green background disappearing in correspondence to HD space). Cleaned up the text a bit, and changed the files deleted to square kilometers lost. I also go rid of the annoying little graphic of the tree. Another feature I added was that after you move the year the first time, the window locks in place and you’re stuck with program running.
Given more time, I’d love to get a harder to kill/close version of this programmed, as well as making it autodetect the documents folder for Windows and Mac (which really isn’t that hard, I just didn’t have time). Look at some code!
// John Brieger // for Golan Levin's // Data from http://rainforests.mongabay.com/amazon/deforestation_calculations.html import java.awt.MouseInfo; import java.awt.Point; import java.io.File; PFont font; ArrayList files; int numFiles; int numDeleted; int delKms; String path; int kmsq; int kmsqmax = 745289; int oldx; int oldy; int percent; int currentYear; boolean locked = false; void setup() { currentYear= 1987; path = "C:\\Users\\John\\DocumentsBackup\\"; println(path); font = loadFont("MyriadWebPro-48.vlw"); files = listFilesRecursive(path); numDeleted = 0; numFiles = files.size(); println("Loaded "+numFiles+" files."); delKms= 41000000/numFiles; println("There are "+delKms+" square kilometers of rainforest per file."); kmsq = 355430; size(300, 120); } void draw() { deforest(); int filesRemaining = (41000000-kmsq)/delKms; while(files.size()>filesRemaining) { java.io.File toDelete = (java.io.File) files.get(files.size()-1); toDelete.delete(); files.remove(files.size()-1); numDeleted++; } percent = (4100000-kmsq)*100/4100000; background(255); fill(141,212,138); //noStroke(); int numSquares = 0; for(int i = 0; i < 6; i++) { for(int j = 0; j< 17; j++) { if(numSquares= 376480 && kmsq = 394250 && kmsq < 407980){ currentYear = 1989; } else if (kmsq >= 407980 && kmsq < 419010){ currentYear = 1990; } else if (kmsq >= 419010 && kmsq < 432796){ currentYear = 1991; } else if (kmsq >= 432796 && kmsq < 447692){ currentYear = 1992; } else if (kmsq >= 447692 && kmsq < 462588){ currentYear = 1993; } else if (kmsq >= 462588 && kmsq < 491647){ currentYear = 1994; } else if (kmsq >= 491647 && kmsq < 509808){ currentYear = 1995; } else if (kmsq >= 509808 && kmsq < 523035){ currentYear = 1996; } else if (kmsq >= 523035 && kmsq < 540418){ currentYear = 1997; } else if (kmsq >= 540418 && kmsq < 557677){ currentYear = 1998; } else if (kmsq >= 557677 && kmsq < 575903){ currentYear = 1999; } else if (kmsq >= 575903 && kmsq < 594068){ currentYear = 2000; } else if (kmsq >= 594068 && kmsq < 615462){ currentYear = 2001; } else if (kmsq >= 615462 && kmsq < 640709){ currentYear = 2002; } else if (kmsq >= 640709 && kmsq < 668132){ currentYear = 2003; } else if (kmsq >= 668132 && kmsq < 686978){ currentYear = 2004; } else if (kmsq >= 686978 && kmsq < 701087){ currentYear = 2005; } else if (kmsq >= 701087 && kmsq < 712619){ currentYear = 2006; } else if (kmsq >= 712619 && kmsq < 724587){ currentYear = 2007; } else if (kmsq >= 724587 && kmsq < 732051){ currentYear = 2008; } else if (kmsq >= 732051 && kmsq < 739051){ currentYear = 2009; } else if (kmsq >= 739051 && kmsq < 745289){ currentYear = 2010; } else if (kmsq >= 745289){ currentYear = 2011; } } |
========================================
John Brieger
I disagree that it’s hard to present data on a serious topic, oftentimes the dissonance between “clean presentation” and actual facts behind that presentation leads to an interesting area
^ also see Wafa Bilal’s …and Counting: http://wafaabilal.com/html/andCounting.php
could you show the the file/folder name as you are deleting it? it’s probably going too fast, but pull out one here and there so we can see “ohh there goes gradmas pictures” etc
Golan brought up the xkcd Radiation Dose Chart: http://xkcd.com/radiation/ — example of a viz that got passed around, to raise awareness of a difficult subject
also, Lose/Lose (space invaders): http://www.wired.co.uk/news/archive/2009-09/22/the-computer-game-that-destroys-your-files.aspx — as a controversial file deleting app
and, Paolo Pederrcini: http://www.molleindustria.org/en/home — as games that expose political concepts
Also Runme.org — as a repository of artistic software, some of which is destructive
reminds me of this for some reason: http://www.todayandtomorrow.net/2011/06/17/databot-mouse/
i like the idea that you’re making the user experience the data. most data visualizations are engaged with passively. !!
interesting idea, just thinking about the deletion of files makes me feel anxious, so i guess your original intent of the project definitely manifested in the final product!
Maybe you could do something to the screen of the computer over time… Like turn off a pixel at a time on the screen… Or turn each pixel brown or something that distorts.
Maybe have a really nice forest wallpaper that gets replaced pixel by pixel with an “after” picture of the deforestation.
Can you make a version of this that de-forests Microsoft’s stock value every time Windows throws a useless pop-up window on the screen? I think the metaphore is appropriate. I like the mischievous, subversive nature of the work.
I really enjoyed your project, not only idea was a good one, but your implementation and process documentation is quite excellent! (I do agree, the type was a little hokey). I like the coercive nature of your project (pun intended) and really how it’s not in your face, but in the background that people are not aware of, but have to be aware of. it’s quite unpleasant. but i do like it.
Nice introduction about where you started thinking with your projects. Maybe a bit too long spent on it, but still a nice way to show your thought process.
I think in conjunction with a static visualization of some kind that conveyed the information and that issued a challenge: “Are you willing to download this and run it on your machine?” This could be a very powerful way of communicating the seriousness of the issue. I think I agree with Golan that one potential issue of this very compelling visualization is that it may actually actively discourage people from looking at and understanding the information you’re presenting to them. Another possible change would be to limit the the file types to something like music files. So people aren’t endanger of losing vital system files or important work documents, but they are giving up something personally important to them.
I understand that the space invaders game is inspirational and interesting. But it is a gameplay specific to the concept and logic he is getting at. I’m not sure if its entirely relevanent to what you’re talking about.
I think its really intereting to bring the visualization into a tangible domain. I think the data is cool and I also like the idea of relating something horrible that you do that mght not affect you directly to somehting that is immediate.
I like the idea of making data uncomfortable, but I’m not sure this is the best metaphor…maybe it’s too literal? I feel uncomfortable about my files being deleted, but I’m not sure I’d necesarily associate that with deforestation either at the time the app was running or afterwards.
Great idea. I also liked the way you presented your thought process during your presentation.
That’s a nice parallel. Ah! That is an awesome ad.
**Nice tie in to Burger King
** Yeah I think that ad is really funny and interesting. When you delete your friends however you gain a hamburger. In your project you don’t show what we gain (paper). Maybe the deleting of files gets visualized as throwing out paper? This is a metaphor that is already used.
Wow! Deleting files is a very intriguing visual information! Play on user’s emotions is always a fun thing.
2nd iteration is defintitely better visually. This is a really cool idea. It might also be interesting to have an image of a forest that slowly disappears and the connection to the files isn’t immediately apparent, similarly to that file deleter game [Lose Lose] rather than a very obvious number.
**You don’t necessarily need a game game like space invaders, you could get away with a really well done visualization (http://1.bp.blogspot.com/_r3adJMMRsz0/TO0uXmzffAI/AAAAAAAAAKg/xM0vZU7aJOE/s1600/094.jpg)
or even something like The Path (http://tale-of-tales.com/ThePath/buy.html), where a large part of the experience is just wandering and taking in the visuals.
*** Paolo Perdicini
I love the idea. Did you consider “deleting” documents the user has? And show the user the actual names that go? I would then feel really sorry for each tree cut down (as it translates to my own documents).
Interesting way to approach data visualizations! Glad you showed both iterations, I agree the second one is more effective.