Kaushal Agrawal – Data Visualization – Mood of the Artist
My project is a visualization of the emotion of the music albums recorded by a particular artist. I love listening to music and was really curious to know how do musicians evolve emotionally with time and number of records. Each album for a particular artist is visualized based on the words contained in the name of the songs for that album. Though the name of the song doesn’t present enough data about the emotion of the song, but it still summarizes the song effectively. The words are rated on the scale of [-5 to +5], -5 being the far end of negative emotion and +5 being the other end.
My initial idea was to use lyrics of song for every album and visualize the emotion using words in the song, more or less like sentiment analysis on paragraphs. I drew some initial sketches to see how would the visualization look like if I managed to get all the data processed and scored for sentiment.
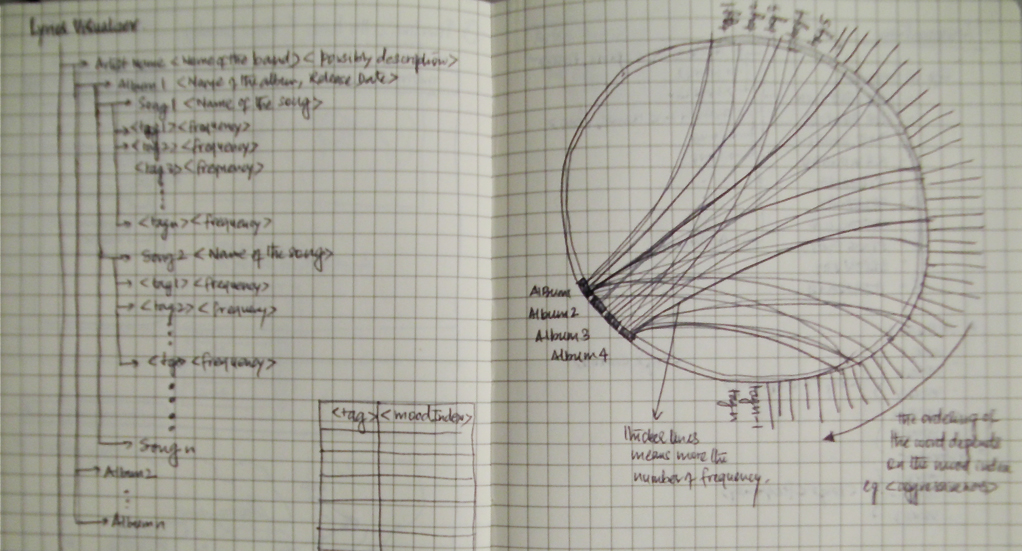
Data collection was the easy part, All I had to do was look upto some lyrics website and scrap the album data onto my computer, However data refining turned out to be a pain. I discovered that the lyrics not only contained English words but also slangs.
GETTING THE DATA
Ex Line: “Speaking words of wisdom, let it be.”
1. Separating the lyrics into words using Lucene (http://lucene.apache.org/core/)
[speaking] [words] [of] [wisdom] [let] [it] [be]
2. Removing the stop words/ commonly occurring English Words (http://www.ranks.nl/resources/stopwords.html)
[speaking] [words] [wisdom] [let]
3. Stemming the words to its root form (http://snowball.tartarus.org/)
[speak] [word] [wisdom] [let]
(The library does an awesome job of converting the words to its root form but also screws up with words like lazy -> lazi, breathing -> breath
4. Assigning an emotion score to the words
a. Affective Norms for English Language(ANEW): a.parsons.edu/~spani621/thesis/context/ANEW.pdf
b. AFINN: http://www2.imm.dtu.dk/pubdb/views/publication_details.php?id=6010
c. SentiStrength: http://sentistrength.wlv.ac.uk
After I got the data in place I made a couple of iterations before I came to my final visualization.
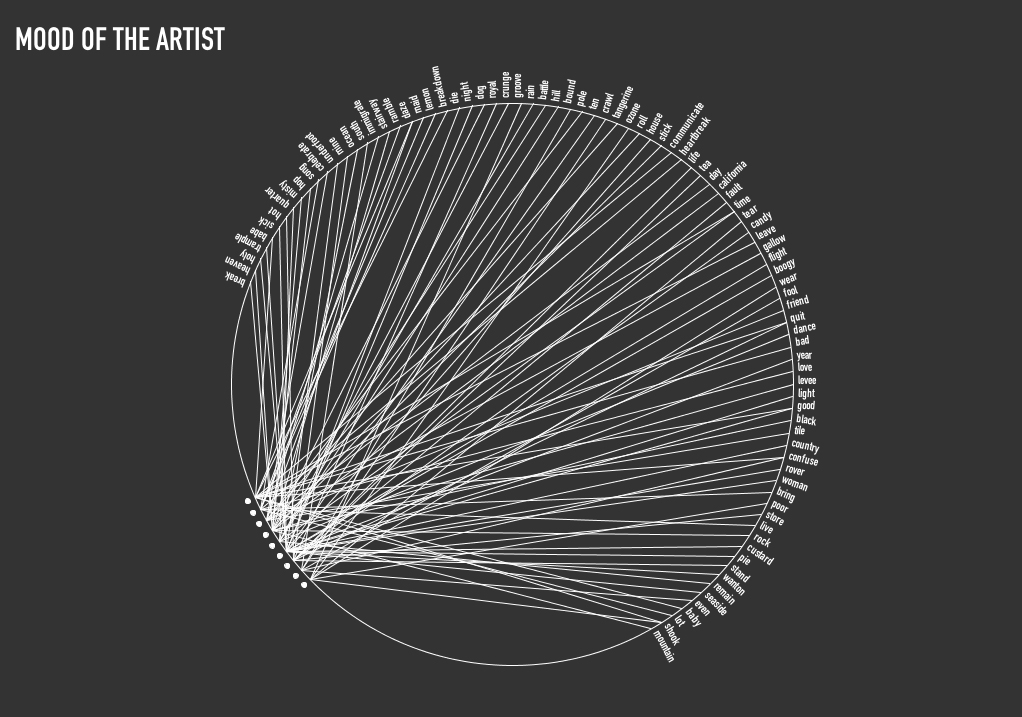
FINAL VERSION:
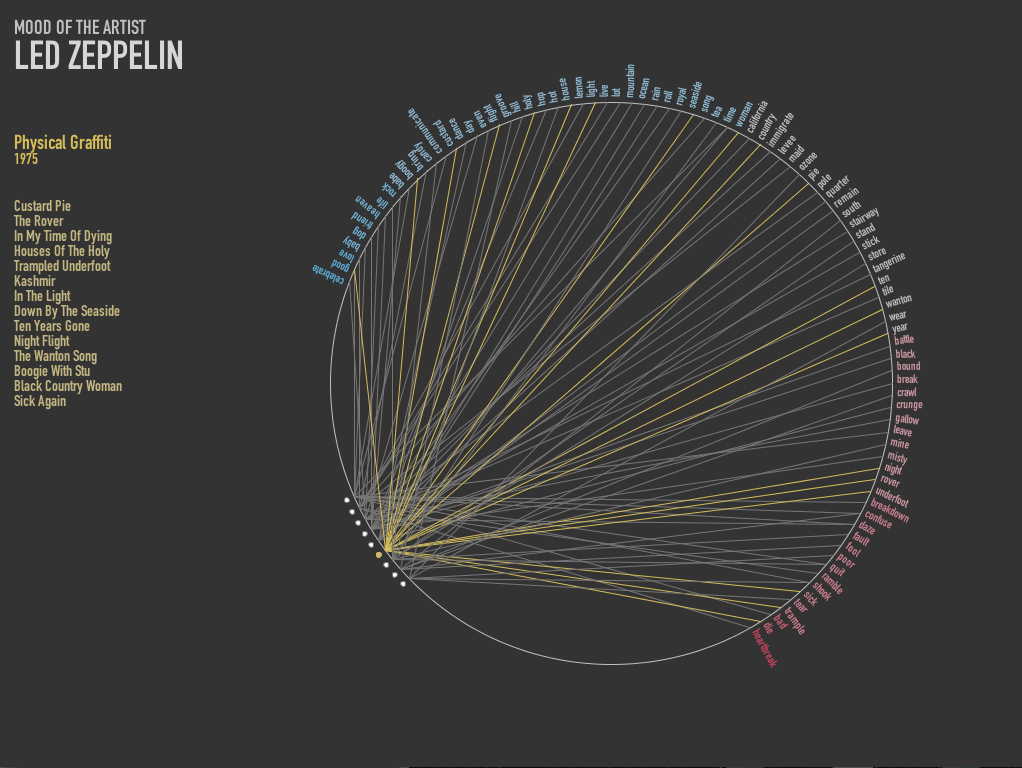
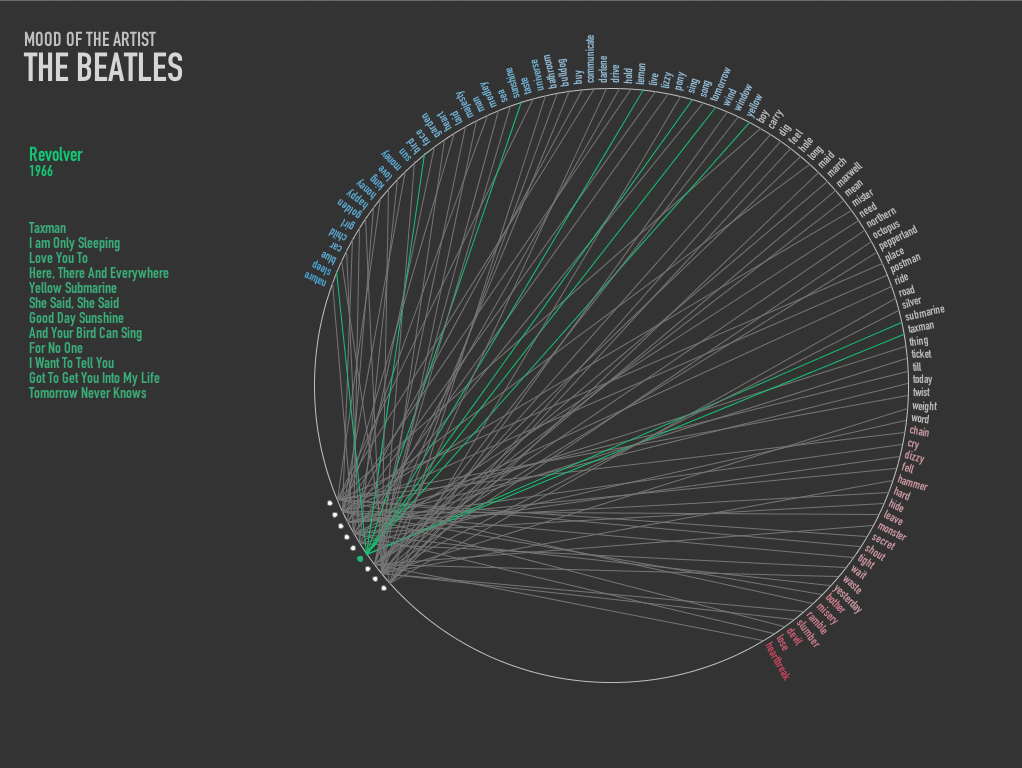
I added color to the words to signify the emotion that goes clockwise from Positive(Blue) to Negative(Green). In the third quarter of the circle the albums of the artists are drawn. The albums are then then linked to the words in the respective albums. On hover over the album circle, Name of the album, the track list and year of release is drawn.
Between the artist it was evident that Beatles used more words with positive emotion (assuming the emotion scoring did its job correctly). However I planned to overlap a couple of artist in one circle get a much better visualization, which I really want to do moving on.
========================================
11. Kaushal Agrawal: Mood of the Artist
good overview of your concept (with sketch)
Golan: “sketches, people!”
this is really cool to look at +1
maybe some more explanation of what all the symbols and words are coming from would make it clearer
“An emotion score” – is that an achievable goal? Lots of these words have no quantitative emotional content.
The final product is quite beautiful, but as you mentioned it’s not the most informative graphic.
I agree, it’s nice to see sketches! It shows the thinking, as well as the goals and vision.
Hey, in your sketch you used curves, but in the software prototype you used straight lines, which don’t look as good.
Check out the bezier and other curve tools in Processing, they make this stuff easy.
It’s hard to get insight from the current visualization.
I think you might have gotten better results from using a different representational scheme: A Small Multiple of Star Charts, or even Chernoff Faces!
Awesome sketches and beautiful final product. Not so sure about the whole emotion score thing. Musicians tend to use words in ways that may not totally conform to the emotion score calculator. (+1 language is tricky)
Damn, nice graphic design… poster-ready+1
those lines scream for bezier curves (yes, arcs would be nice… there are line clustering algorithms available for doing these sorts of ring charts–the library prefuse flare does this: http://lukeloeffler.com/2009/visualizing-discussion/ for example)
Pandora has people analyzing all the songs over a multitude of dimensions which they use to cluster songs… Do they by chance have an API? If not, what if you picked an artist that was whiny like bon iver, and then tried to game the system to see who pops up related to that? And who pops up related to “happy” artists/songs/albums… I guess that would take a lot of iterations to work… But finding a better database may help.
your design is great. every three outcome? visualization is unique and beautiful.
awesome job Kaushal! you so stylin’ ^_^>
Very neat visualization. Though I kind of wish that you explored a couple of graphic methods to illustrate your data. It’s still beautiful, don’t get me wrong, but judging from a purely visual basis, it looks like I’ve seen this before. With your programming prowess, I bet other explorations would have been a piece of cake!
BEAUTIFUL VISUALS. Also, A+ for good musical taste. ;) I wonder what it would look like with curves instead of straight lines connecting the points. If this were interactive, I think I’d like to be able to reverse these connections as well: hover over an emotion somehow and see all the albums that convey that emotion. It would also be cool to compare musical genres. If you went with Billboard top 10 charts or something to find individual songs and break them down by style: metal, indie, hip hop, &c; I’d find it interesting to compare emotional trends across all of these different styles of music.
it looks pretty cool and its a great idea.
Good drummer. Great look, good drummer. This would be an interesting analysis for different eras of music: 60’s, 70’s, 80’s, 90’s etc. With music being a cultural barometer and usually being a bit subversive, sentiment analysis alone may be a new way of looking at music history. Imagine Ella Fitzgerald “You do something to me”, vs/ NIN Inch Nails “Closer”.
Don’t think it would be a good idea to overlay different artists, it would be very confusing. More fruitful to compare them side by side. I agree with golan on the potential of the star-chart idea. Cool idea to go into the mind of the artist.
If feel like having the lines from non-focused albums visible makes it difficult to see where the lines from the current album are heading. It might work better in an interactive app, but I don’t think it works in the static image.
I love seeing sketches of work in the website!
**Great sketch.
**Yes!
It’s really a beautiful visualization. It’s hard to see what it says, looking at it on this scale.
cool way to visualize the information! truly effective.
This is very nicely laid out.
There is a really cool data visualization done on what body part is mentioned most frequently in different genres of music… I am blanking on the name and the artists. You might be interested in
taking a look at how they approached it (if you haven’t seen it already), but if you are ask Golan and I’m sure he can give you the name to look up.