 Summary: A Data Generative Art Project: Global Economy Rosalization
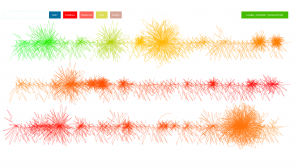
Abstract: I used Processing to visualizeglobal economy. The flower-like lines sketches are generated from four key index data from IMF.
Repository: https://github.com/mengs/EconRose.git
Summary: A Data Generative Art Project: Global Economy Rosalization
Abstract: I used Processing to visualizeglobal economy. The flower-like lines sketches are generated from four key index data from IMF.
Repository: https://github.com/mengs/EconRose.git
I used Processing to visualizeglobal economy. The flower-like lines sketches are generated from four key index data from IMF. More information about the data are in the end of the passage.
Before I get started the data visualization project, I read a report about global risks from World Economic Forum in January. In that report, the data pie charts in the appendix are very difficult to read. Also, as a general reader, I was not reading data charts as serious and carefully as professional analysts. I read it graphically instead. So I define my project in be making data more impressive, generating more feeling in the common reader, in form of “data generative art”.
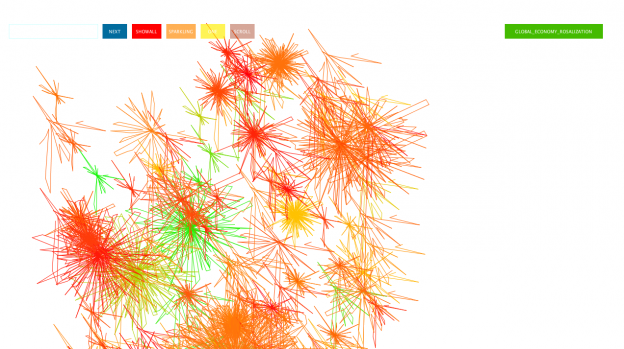
I chose global economic related visualization as one of my initial ideas. During the project, I feel I am interpreting one media to another, or building a bridge between different dialogues. Maybe the interpretation is not very powerful/impressivecurrently – more like fun doodle or eye candy. But I tried to make the data be more impressive by interpreting the economic data to roses.
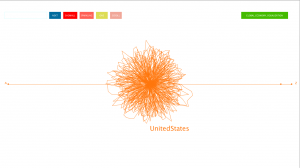
I chose Processing as my coding environment, and started by drawing a line-rose with some magic numbers. The picture is pretty rose-like. But after using the real data. The economy of the countries kinda freak out, not like a rose at all( or like a crazy rose).


I basically learn coding/processing by myself. During my time writing the code, feel my code is not well written (I feel puzzled at when there are more than one ways of writing it but I can’t tell which is the better way),for example, not-efficiency, bad structure. I want to write elegant code. If anyone could take a look at my code at github and pointing out some problems, I would be very glad! (Thanks in advance!)
[youtube http://www.youtube.com/watch?v=9vwYzlaK9ME]
Finally, this is the source code at git hub
https://github.com/mengs/EconRose
PS: About Data
Data Source:
October 2012 World Economic Outlook
IMF http://www.imf.org/
Selected Data Items:
GDP
Inflation
Population
Government Revenue
Total sample:
185 Countries