 Summary: An interactive data visualization built on node.js and processing.js
Abstract: QuakeTime is an interactive data visualization illustrating recent earthquake activity from around the world.
Repository: https://github.com/johngruen/quakeTime
Summary: An interactive data visualization built on node.js and processing.js
Abstract: QuakeTime is an interactive data visualization illustrating recent earthquake activity from around the world.
Repository: https://github.com/johngruen/quakeTime
Let’s start with a quick video:
About the Project
The idea for QuakeTime started with a vague notion of modeling geological data in an abstract but interpretable manner. The USGS quake data provided a nice wrapper for this concept in a week where North Korean nuclear bomb tests were verified through seismographic readings.
Once I’d solved the technical problems of capturing and parsing data for QuakeTime, i quickly realized that plotting ~900 points–roughly the number of earthquakes per week recorded in the USGS data–on a reasonably hi-resolution screen didn’t produce very compelling visuals. I spent a great deal of time refining the viewing experience of the data with particular focus on (a) making something that was abstract on first read but became clearer through exploration (b) pretty and ( c ) navigable.
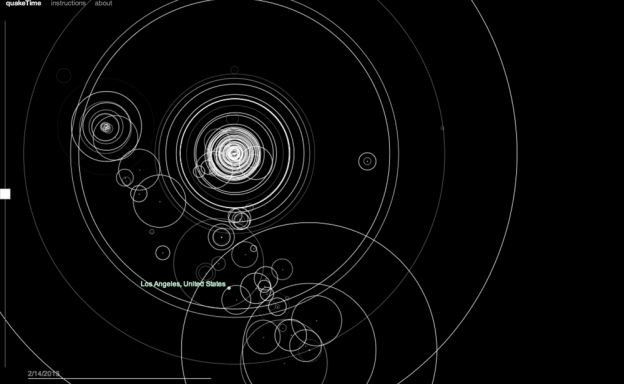
I played around with a number of visual representations of the quakes–even stepping briefly into WebGL territory–before coming around to a series of expanding and fading bubbles. I wanted to convey a a sense of a slow boil: a process that’s violent and sudden in one sense, but steady and continuous in another.
When presenting the piece, I heard a fair amount of criticism about a lack of map backing the data. I’m still sure I want one….I’ve tested a few and the project winds up looking extremely literal and/or like a nuclear war simulation. I did–as a pean to the masses–add data points for 20 of the world’s largest cities for visual reference. I’ve also added instructions and a brief about page to the site to make it a bit more accessible/inviting.
Technical Considerations
QuakeTime consists primarily of two distinct components:
First, it uses node.js as a server and data scaper. Node.js is an implementation of Chrome’s JS runtime that facilitates the deployment of javascript based server and web apps. Because it’s javascript, node.js has an extremely broad developer base with tons of excellent modules (librairies) available through NPM. For this project I used several modules:
- CSV: a csv parser/reader and writer to strip data off the USGS website and write it to a local file , and then to convert the csv to a json array to be passed to the client.
- Express: an easy to deploy application framework + the jade HTML and stylus CSS templating engines
- Socket.io: for sending asynchronous data to the client.
On the front end, QuakeTime uses Processing.js to render content. For this project, I had to write processing.js as pure javascript rather than as an external PDE in order to get the necessary interplay between variables coming in off the node server and the data visualization itself. I haven’t touched processing.js in several years, and was very pleasantly surprised by how fluidly it integrated with plain old javascript.