Final Project- GroupAlytics – CSB
GroupAlytics solves the problem of acquiring useful analytics about Facebook Groups from Facebook’s unwieldy Graph API. It also expands on my ongoing durational work Productive Substitute, providing another facet to the documentation I have been compiling.
Productive Substitute: https://www.facebook.com/groups/231149907051192/
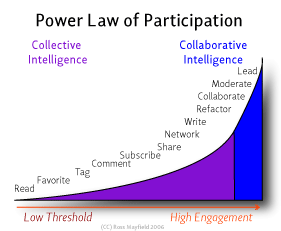
GroupAlytics is a pipeline that strips the Graph API of all data from the life span of any Facebook Group and visualizes the users’ engagement over time in a 3D scatterplot. A user of the service can input any Facebook Group ID (found in the URL of the group) and receive useful and often enlightening analytics as well as a visualization. The order of the pipeline is Graph API -> Python -> MATLAB. I’m still working on developing and perfecting it so it is more automatic and so that the end visualization is also web-based (possibly using D3. It is interesting to compare the user engagement over time by author ID with the power law of participation, shown below.
Power Law of Participation:
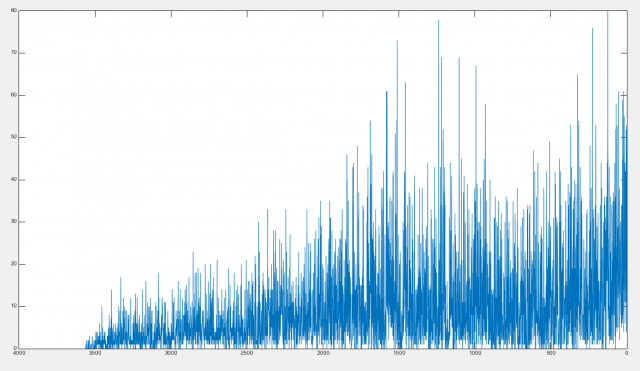
Another 2D version of the visualization:
*Thanks to Maddy Varner for helping me figure out the back-end, python side of things*
Python script that scrapes all info from the Facebook’s Graph API:
import json, collections, facebook, urllib2

'''replace token w new token'''

oauth_access_token = "CAACEdEose0cBAEZB6SNyyYCBwYyuDf4eKe14Lp88ZCHMTU8Q7mQCk559gmcNUCqksWdz2q67ygE0YvkwIbNvDDYs36QkyZC0Br3FRwHgTOLuAvjhpLUPAk3igMRrytjVtAVNO53E8mUF2dfuGK2I3ZAMuuYmqZAZACqydeRyZC1xcdcnsha8MwT2BNeIrBNEtYRfHiz0nSiCZCPi0pAZBhGc8"

graph = facebook.GraphAPI(oauth_access_token)

def get_memes():

	'''get the graph'''

	group = graph.get_object("231149907051192/feed", limit=999)

	current = group

	iteration = 0

	while current != False:

		saveName = "%d.json" % iteration

		download_memes(current, saveName)

		if "paging" in current and "next" in current["paging"]:

			url = current["paging"]["next"]

			page = urllib2.urlopen(url)

			next = json.load(page)

		else:

			next = False

		iteration += 1

		current = next

def download_memes(data, saveName):

	print type(data)

	#ok now expand all comment/like data ^______^

	for post in xrange(len(data["data"])):

		datum = data["data"][post]

		#it's a dictionary so im just making sure the key is in the dictionary before accessing it

		if "likes" in datum:

			if "next" in datum["likes"]["paging"]:

				try:

					excess = slurp(datum["likes"]["paging"]["next"])

					datum["likes"]["data"].extend(excess)

				except:

					print "keyerror?	", datum["likes"]["paging"]

		if "comments" in datum:

			if "next" in datum["comments"]["paging"]:

				try:

					excess = slurp(datum["likes"]["paging"]["next"])

					datum["comments"]["data"].extend(excess)

				except:

					print "keyerror?	", datum["comments"]["paging"]

	#SAVE IT ALLLLL TO A SINGLE FILE LMFAO

	with open(saveName, 'w') as save:

		save.write(json.dumps(data, sort_keys=True, indent=2))

#this crawls thru next links and then merges all the data

def slurp(next):

	response = urllib2.urlopen(next)

	data = json.load(response)

	laterData     = []

	currentData   = []

	if "data" in data:

		currentData = data["data"]

		if "paging" in data and "next" in data["paging"]:

			laterData = slurp(data["paging"]["next"])

	if laterData != None and currentData != None:

		currentData.extend(laterData)

	return currentData

def combine_memes():

	with open('0.json') as json_data:

		root = json.load(json_data)

		for i in xrange(1,17):

			name = "%d.json" % i

			with open(name) as lil_data:

				data = json.load(lil_data)

				root["data"].extend(data["data"])

		with open("internet_lonely_ULTIMATE.json", 'w') as save:

			save.write(json.dumps(root, sort_keys=True, indent=2))

#########################################################

get_memes()

combine_memes()
Python script that takes Json file from Facebook’s Graph API and outputs both some analytics in text form and a spreadsheet of the parameterized data:
import json

import collections

import xlwt

#making sure i open the json file safely

with open('internet_lonely_ULTIMATE.json') as data_file:

    # loading the json data

    data = json.load(data_file)

    postCount = len(data["data"])

    likeCount = 0

    mostLiked = 0

    commentCount = 0

    dates = []

    posters = []

    engagement = []

    # im iterating thru each post in the dataset

    for post in xrange(len(data["data"])):

        datum = data["data"][post]

        #it's a dictionary so im just making sure the key is in the dictionary before accessing it

        if "likes" in datum:

            likeCount += len(datum["likes"]["data"])

            if (mostLiked < len(datum["likes"]["data"])):
                mostLiked = len(datum["likes"]["data"])
                mostLikedInfo = datum
        if "comments" in datum:
            commentCount += len(data["data"][post]["comments"]["data"])
        if "created_time" in datum:
            time_made = str(data["data"][post]["created_time"])[:10]
            dates.append(time_made)
        if "from" in datum:
            posters.append(datum["from"]["name"])

        if "from" in datum and "created_time" in datum and "id" in datum:
            if "likes" in datum:
                yay = len(datum["likes"]["data"])
            else:
                yay = 0
            time = datum["updated_time"]
            year = int(time[:4])
            month = int(time[5:7])
            day = int(time[8:10])
            hour = int(time[11:13])
            minute = int(time[14:16])
            engagement.append([month, day, year, hour, minute, datum["from"]["name"], yay, int(datum["id"][16:]), int(datum["from"]["id"])])
    book = xlwt.Workbook(encoding="utf-8")
    sheet1 = book.add_sheet("Sheet 1")
    sheet1.write(0,0,"Month")
    sheet1.write(0,1,"Day")
    sheet1.write(0,2,"Year")
    sheet1.write(0,3,"Hour")
    sheet1.write(0,4,"Minute")
    sheet1.write(0,5,"Posted By")
    sheet1.write(0,6,"Likes")
    sheet1.write(0,7,"Post ID")
    sheet1.write(0,8,"Author ID")
    for x in xrange(len(engagement)):
        print x
        sheet1.write(x+1,0, engagement[x][0])
        sheet1.write(x+1,1, engagement[x][1])
        sheet1.write(x+1,2, engagement[x][2])
        sheet1.write(x+1,3, engagement[x][3])
        sheet1.write(x+1,4, engagement[x][4])
        sheet1.write(x+1,5, engagement[x][5])
        sheet1.write(x+1,6, engagement[x][6])
        sheet1.write(x+1,7, engagement[x][7])
        sheet1.write(x+1,8, engagement[x][8])
    book.save("test.xls")
    print engagement[1]
    #aggregates total comments, likes, and posts for the json file
    print commentCount,"comments,", likeCount, "likes and", postCount, "posts ALL"
    dates = sorted(dates)
    date_counter=collections.Counter(dates)
    poster_counter=collections.Counter(posters)
    # prints counts for amount of posts
    print len(poster_counter), "people have ever posted to the group!"
    # prints the top posters in descending order
    print "Top Posters:"
    for letter, count in poster_counter.most_common(15):
        print '  %s: %d' % (letter, count)
    print# prints dates when the most posts were made in descending order
    print "Most Popular Days to Post:"
    for letter, count in date_counter.most_common(3):
        print '  %s: %d' % (letter, count)
    print
    #most liked post
    print mostLikedInfo["from"]["name"], "with", mostLiked,"likes, and here's the link:", mostLikedInfo["actions"]
MATLAB code that processes the data from the spreadsheet generated in python to be visualized in the 3d scatterplot:
load('/Users/Charlie/Desktop/struct_psbetter.mat')
i = 1;
for i = 1:length(struct_psbetter)
a = struct_psbetter(i).CreatedTime;
CreatedTime_var([i],:) = cellstr(a);
b = struct_psbetter(i).PostedBy;
PostedBy_var([i],:) = cellstr(b);
c = struct_psbetter(i).Likes;
Likes_var([i],:) = c;
end
%duplicates and turns struct into cell array
struct_psbetterCopy = struct_psbetter;
cells_psbetter = struct2cell(struct_psbetterCopy);
%changes the 3 structs to doubles/matrices
%works
like_counts_cell = cells_psbetter(3,:);
like_counts_mat = cell2mat(like_counts_cell);
like_counts_double = double(like_counts_mat);
%doesn't work- why converts strings to ints??
CreatedTime_cell = cells_psbetter(1,:);
CreatedTime_mat = cell2mat(CreatedTime_cell);
CreatedTime_double = double(CreatedTime_mat);
%doesn't work- why converts strings to ints??
PostedBy_cell = cells_psbetter(2,:);
PostedBy_mat = cell2mat(PostedBy_cell);
PostedBy_double = double(PostedBy_mat);
sparse_mat_CreatedTime = sparse(CreatedTime_double);
sparse_mat_PostedBy = sparse(PostedBy_double);
sparse_mat_like_counts = sparse(like_counts_double);
for i = 1:length(day)
timestamp(i) = datenum(year(i),month(i),day(i),hour(i),minute(i),second(i));
timestamp(i) = timestamp(i) * .005;
end
MATLAB code to automatically generate 3D scatterplot of analytics from parameterized JSON data from Facebook’s Graph API:
function createfigure(timestamp, authorid, likes)

%CREATEFIGURE(TIMESTAMP1, AUTHORID1, LIKES1, S1, AUTHORID2)

%  TIMESTAMP1:  scatter3 x

%  AUTHORID1:  scatter3 y

%  LIKES1:  scatter3 z

%  S1:  scatter3 s

%  AUTHORID2:  scatter3 c
% Auto-generated by MATLAB on 03-Dec-2014 17:49:19
% Create figure
figure1 = figure;
colormap('lines');
% Create axes
axes1 = axes('Parent',figure1,'CLim',[544321851 922337203685478],...
'FontSize',14,...
'FontName','Caviar Dreams');
view(axes1,[50.5 38]);
grid(axes1,'on');
hold(axes1,'on');
% Create zlabel
zlabel('Likes (per post)','FontSize',15.4);
% Create ylabel
ylabel('Author (ID)','FontSize',15.4);
% Create xlabel
xlabel('Time (1 Year)','FontSize',15.4);
% Create title
title({' Facebook Group Analytics ? User Engagement Scatterplot'},...
'FontSize',15.4);
% Create scatter3
scatter3(timestamp,authorid,likes)