Project 1: Flickr Scrape + Face Averaging

by jonathan @ 8:26 am 7 February 2012

For the first “real” project, I initially had a bit of trouble deciding what kinds of data I wanted to obtain. Initially I was pretty set on using Twitter and the Twitter 4j library for Processing. I was entranced by the thought of tapping into the real-time thoughts of Twitter users of Pittsburgh in relationship to the weather. I planned on creating a gradiation of color swatches by taking a photograph of the sky, averaging the color, and relating this color to the tweets during this time exploring the possibility that perhaps cloud breaks or the rare rays of sunshine would drastically affect the mood of local Pittsburghers. However, my idea lacked depth and the topic of weather was pretty much off limits for this project.

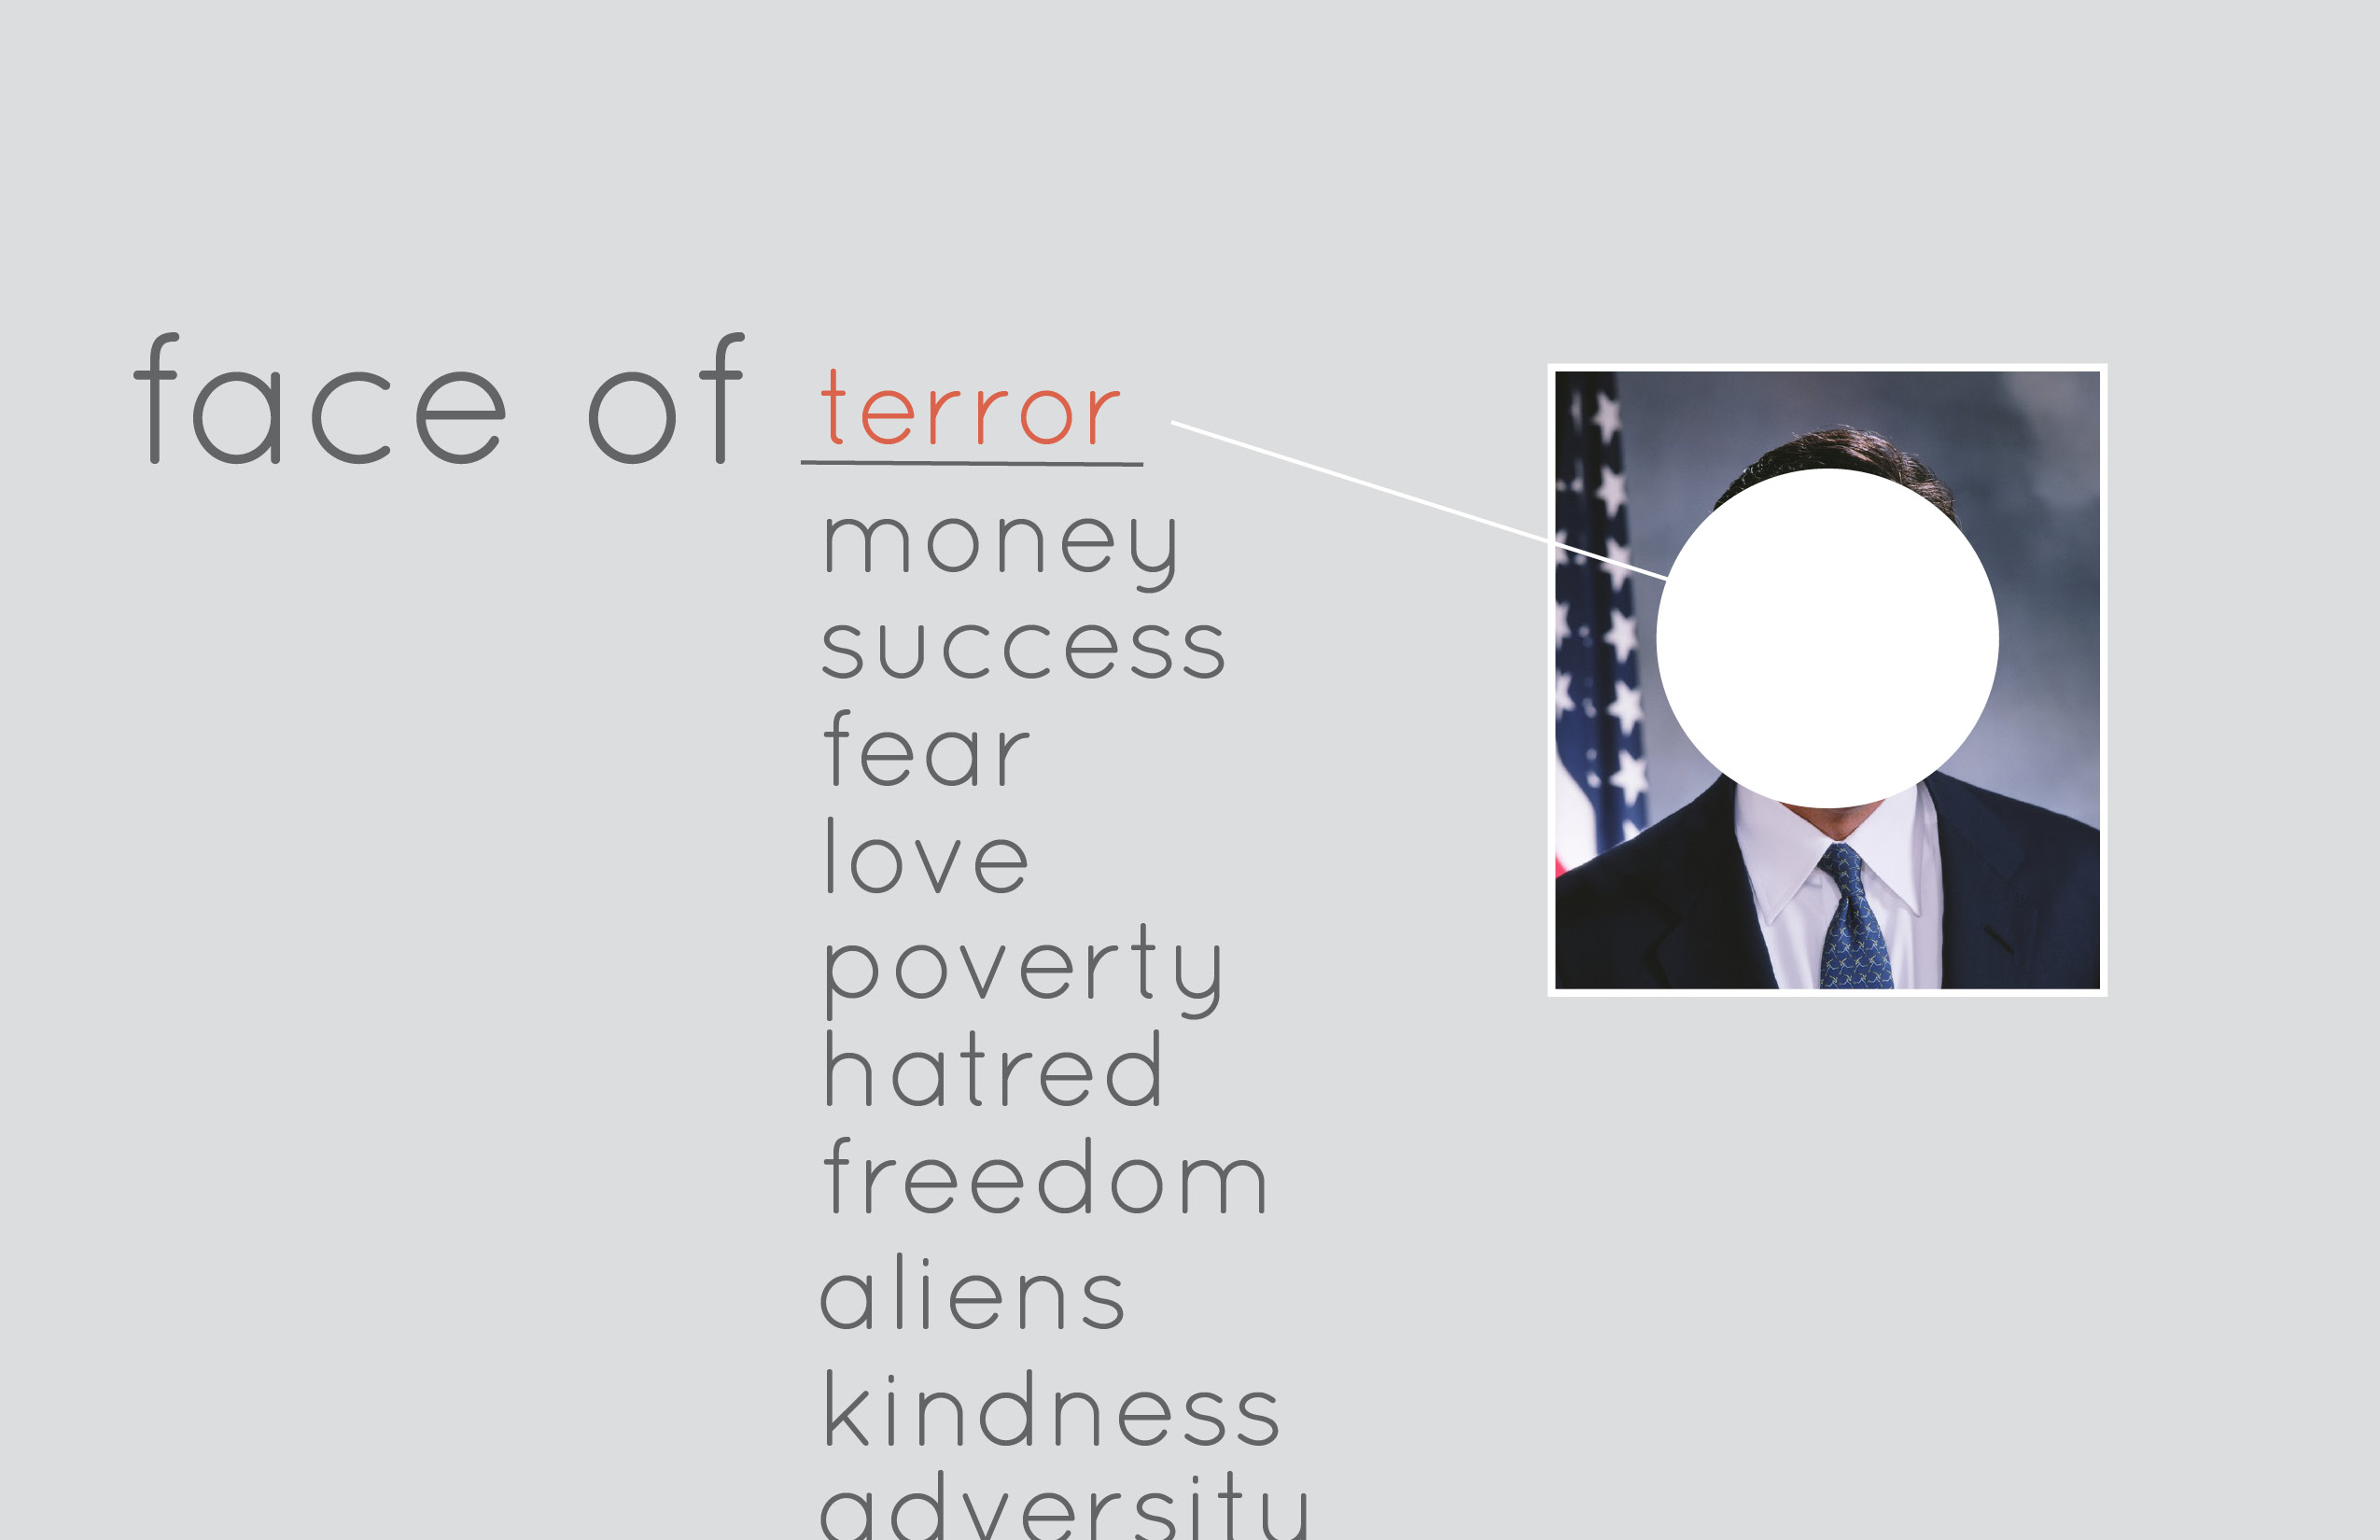
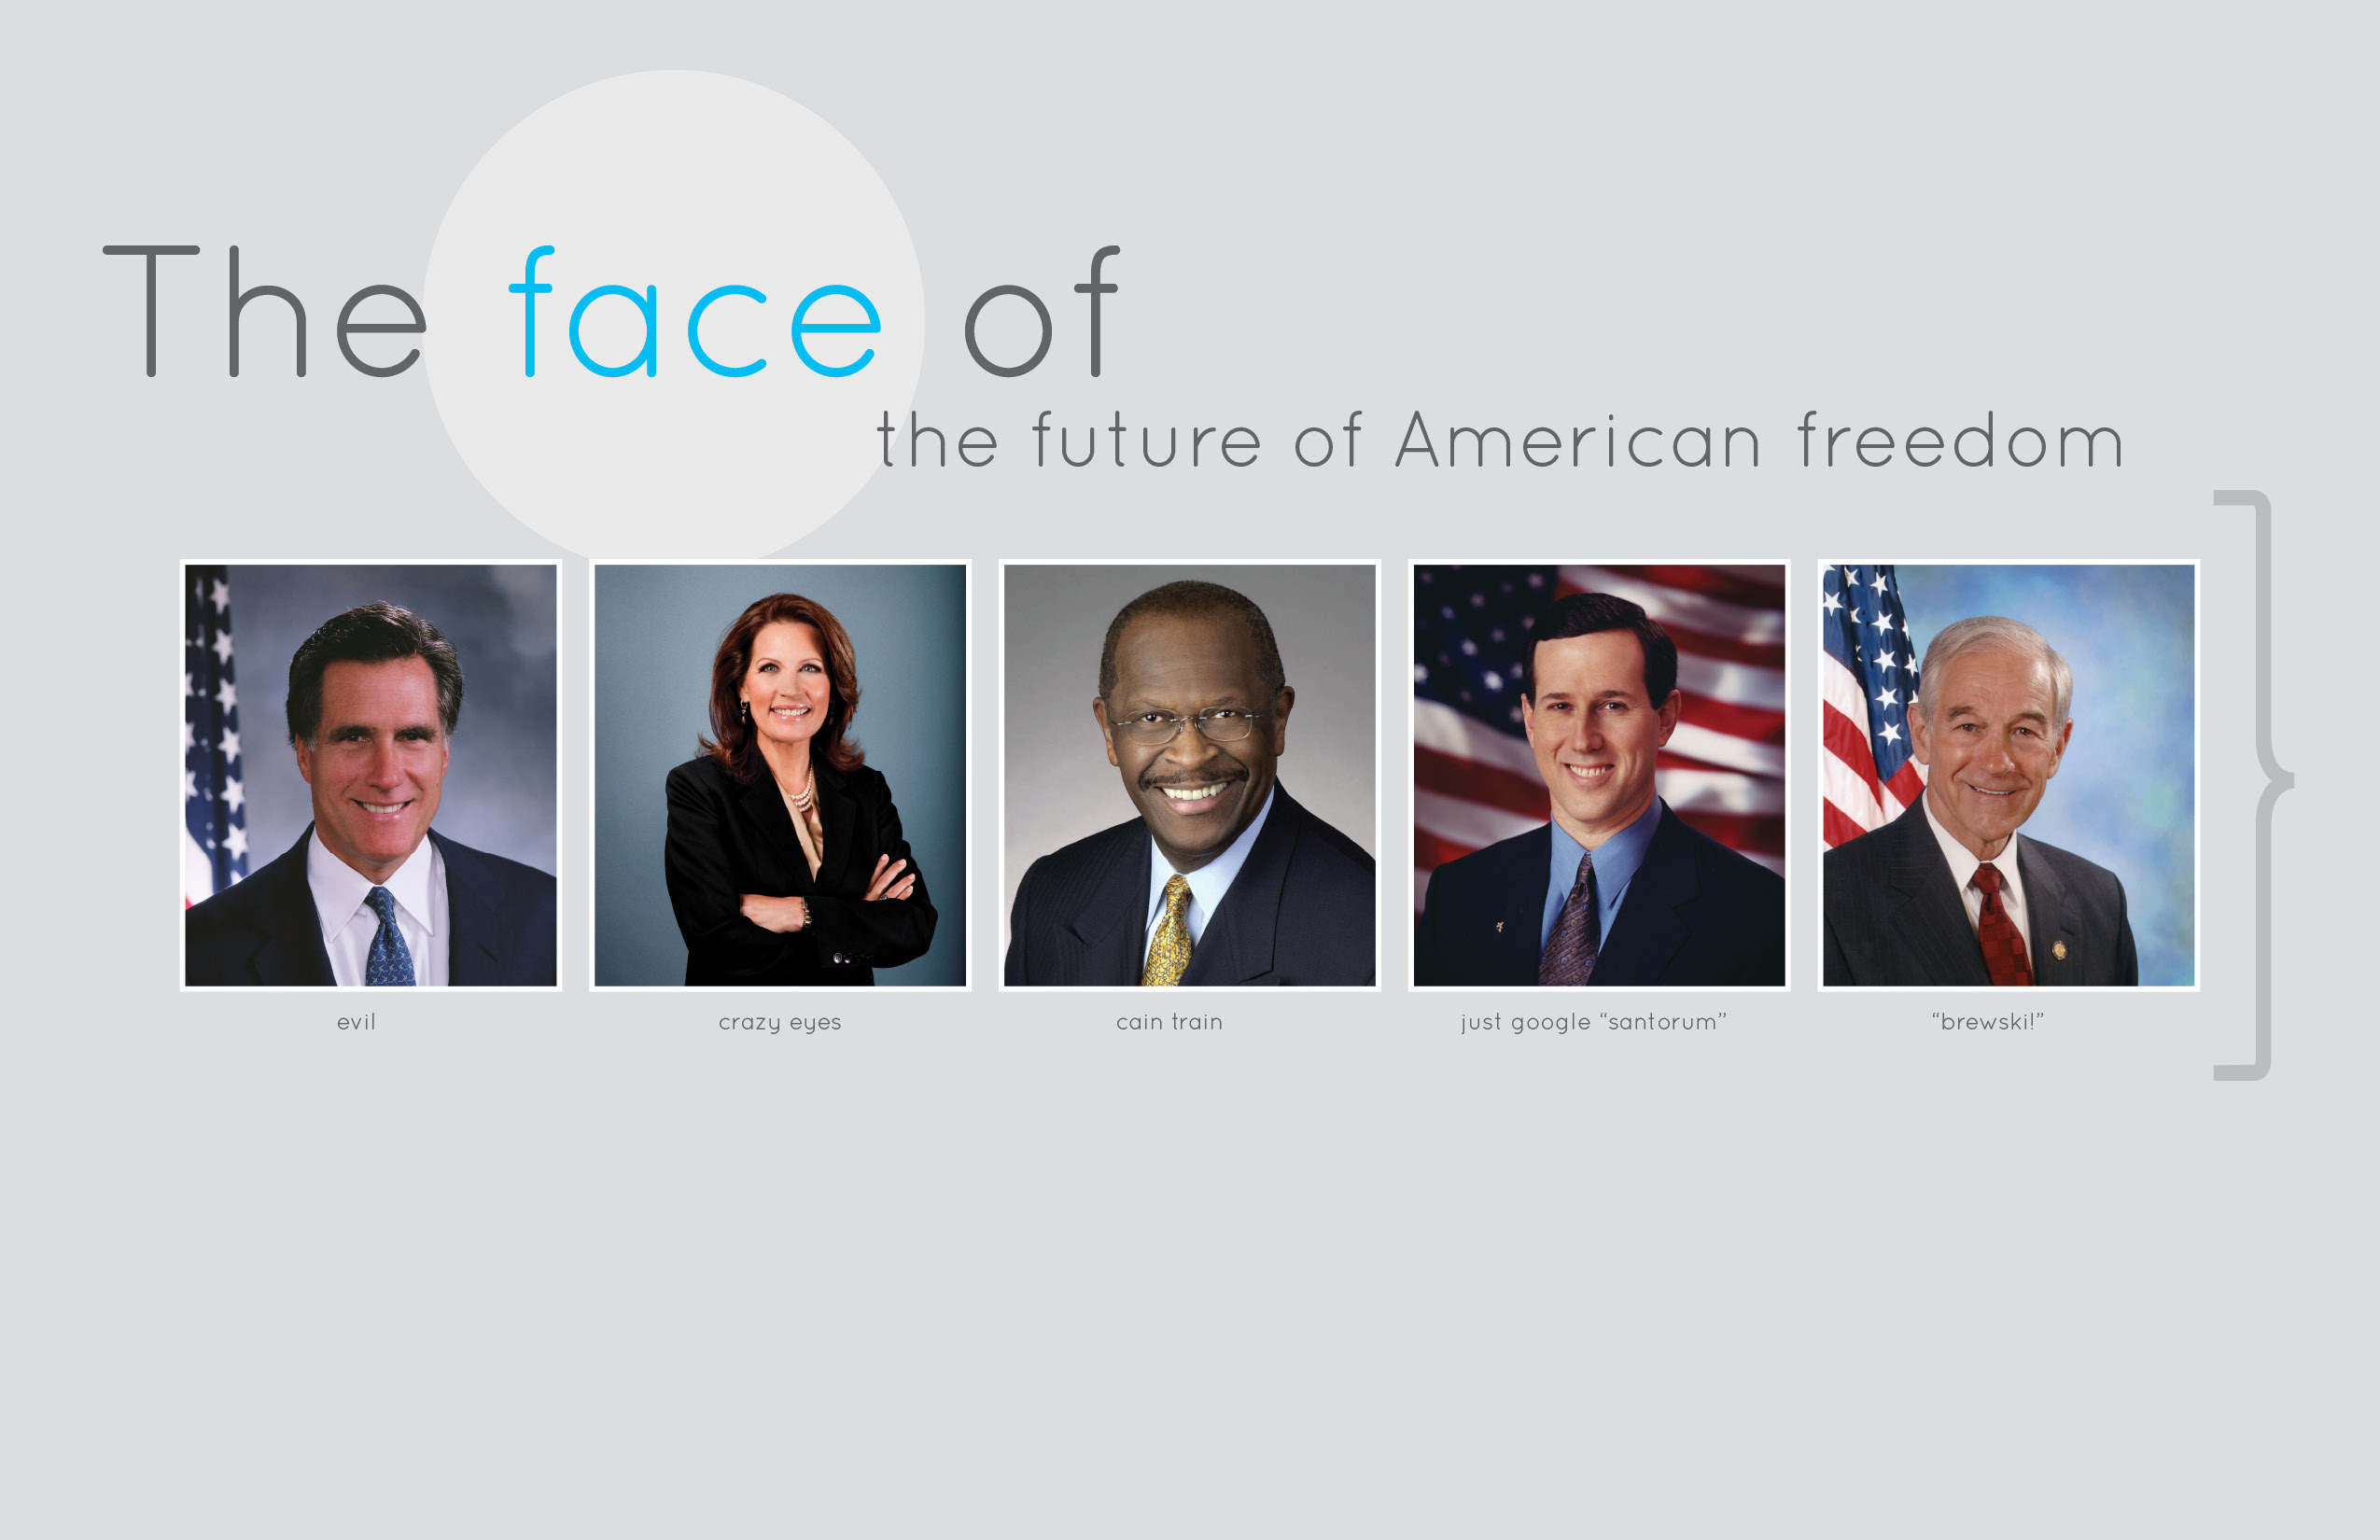
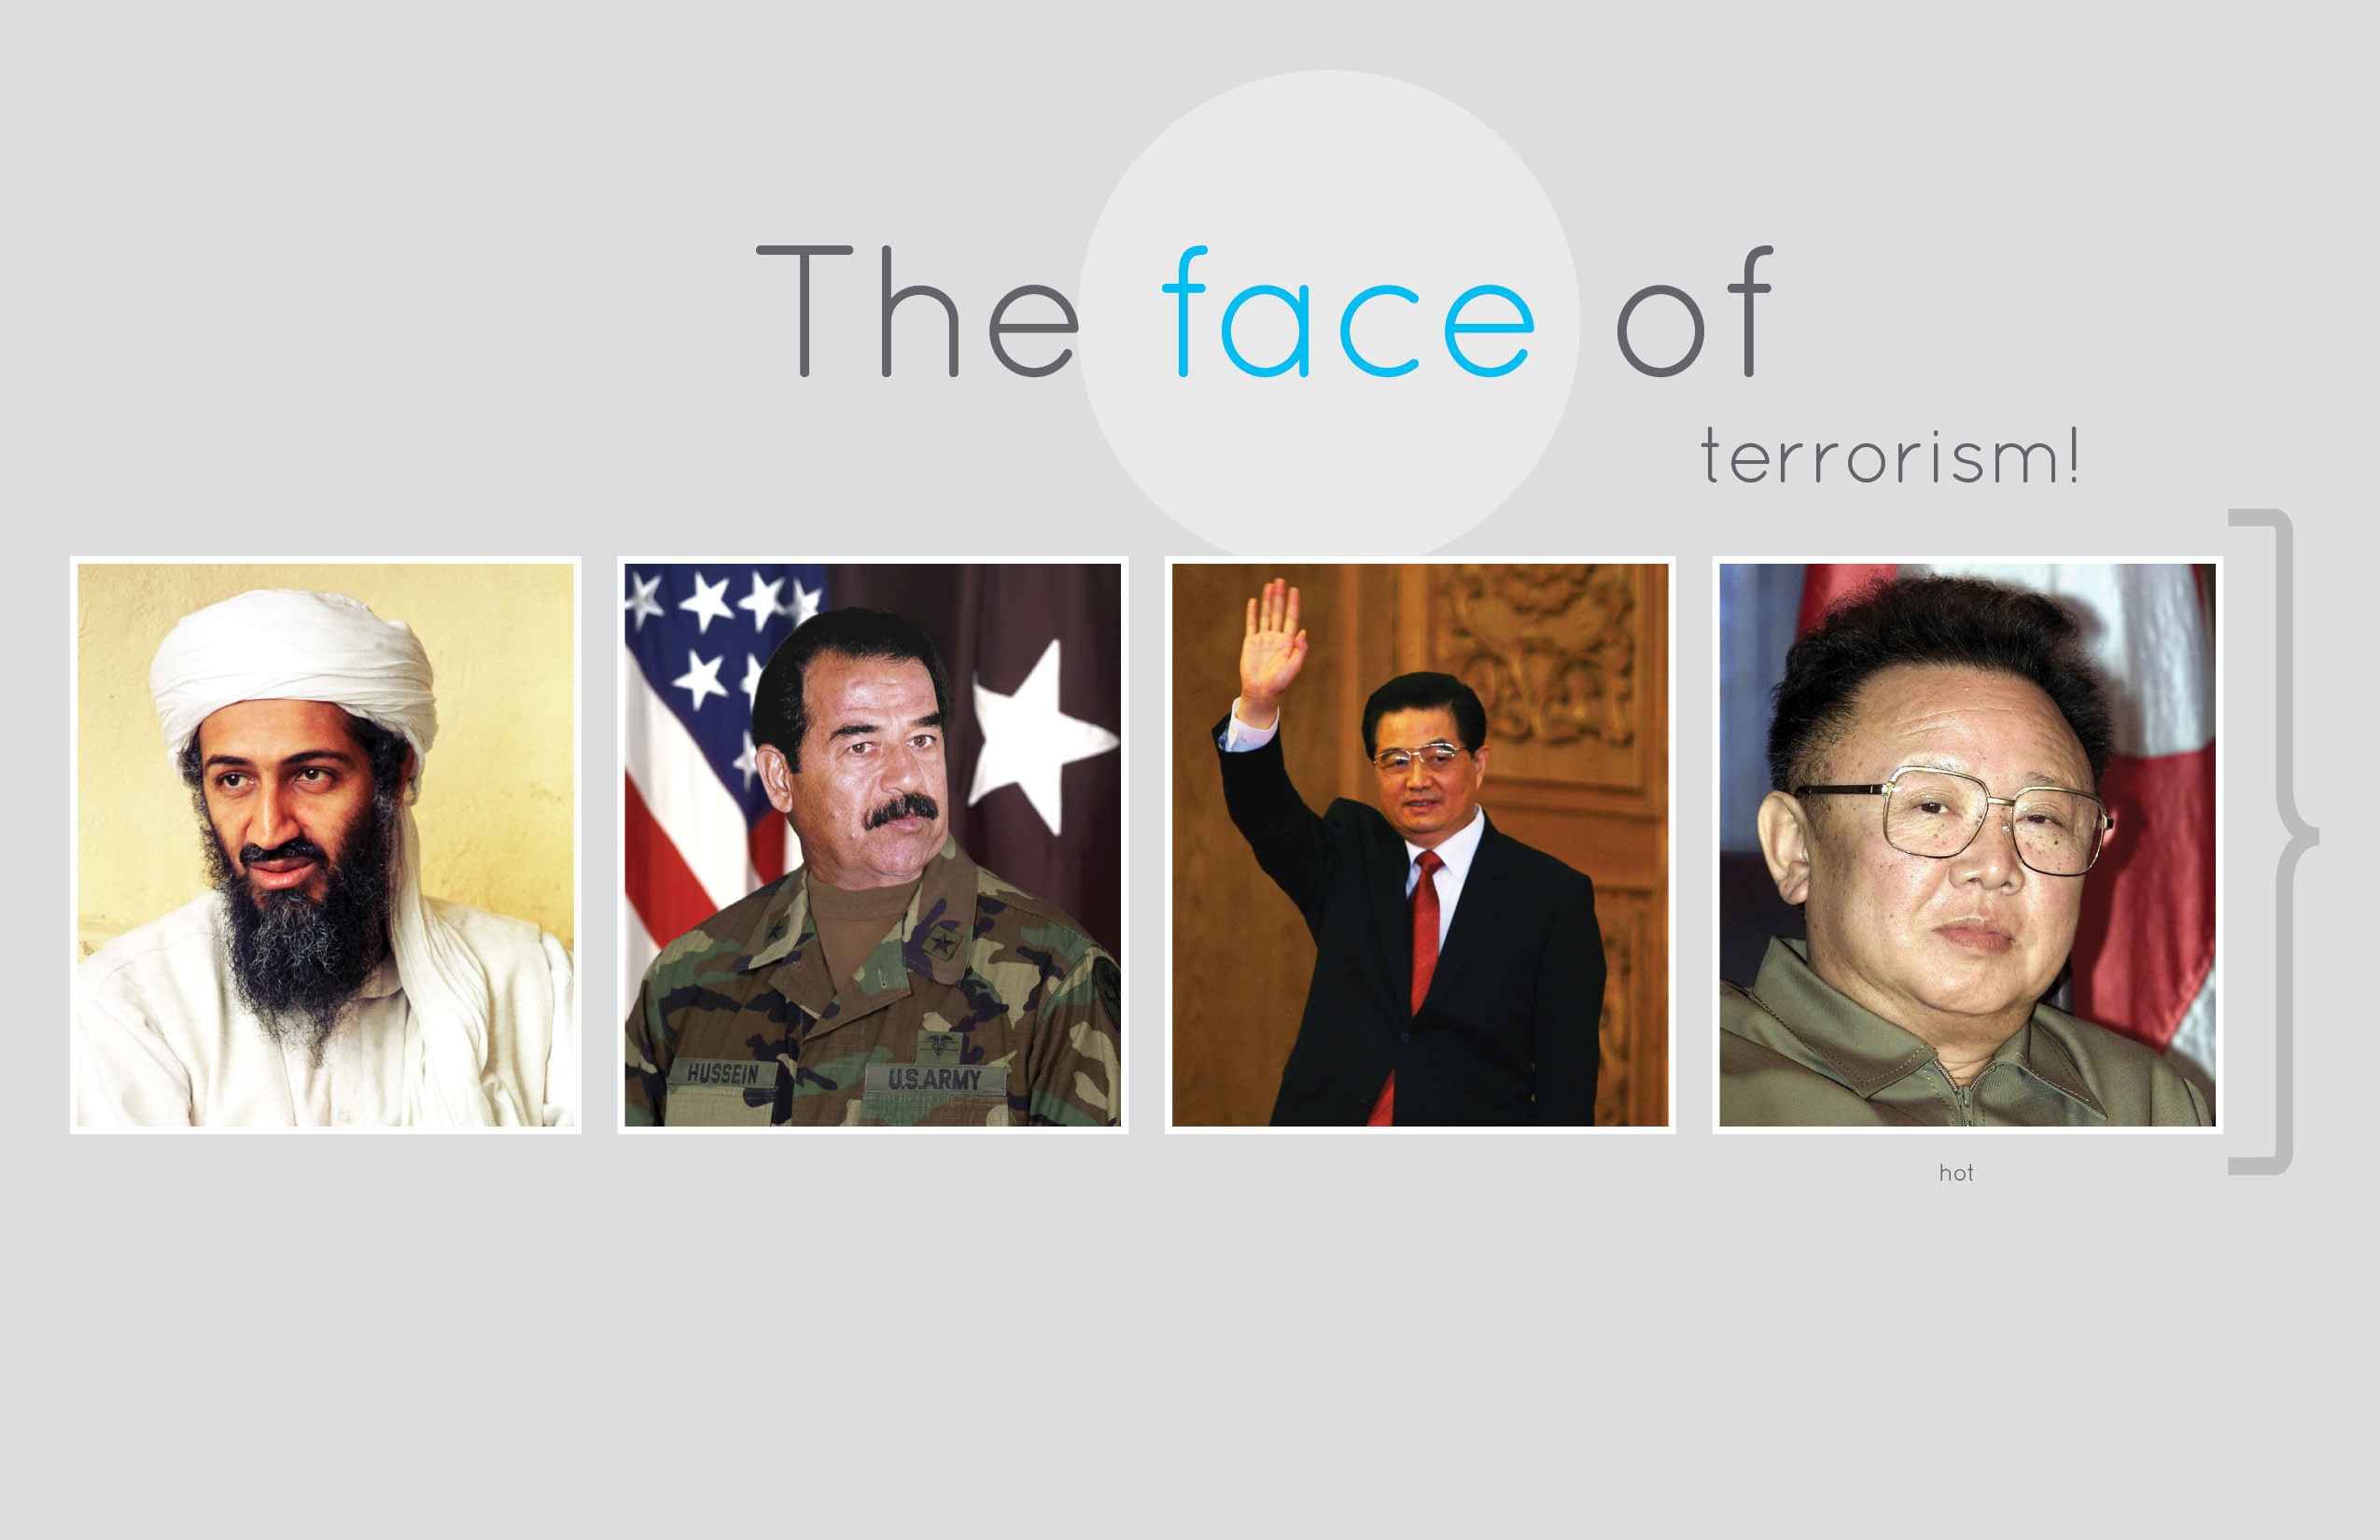
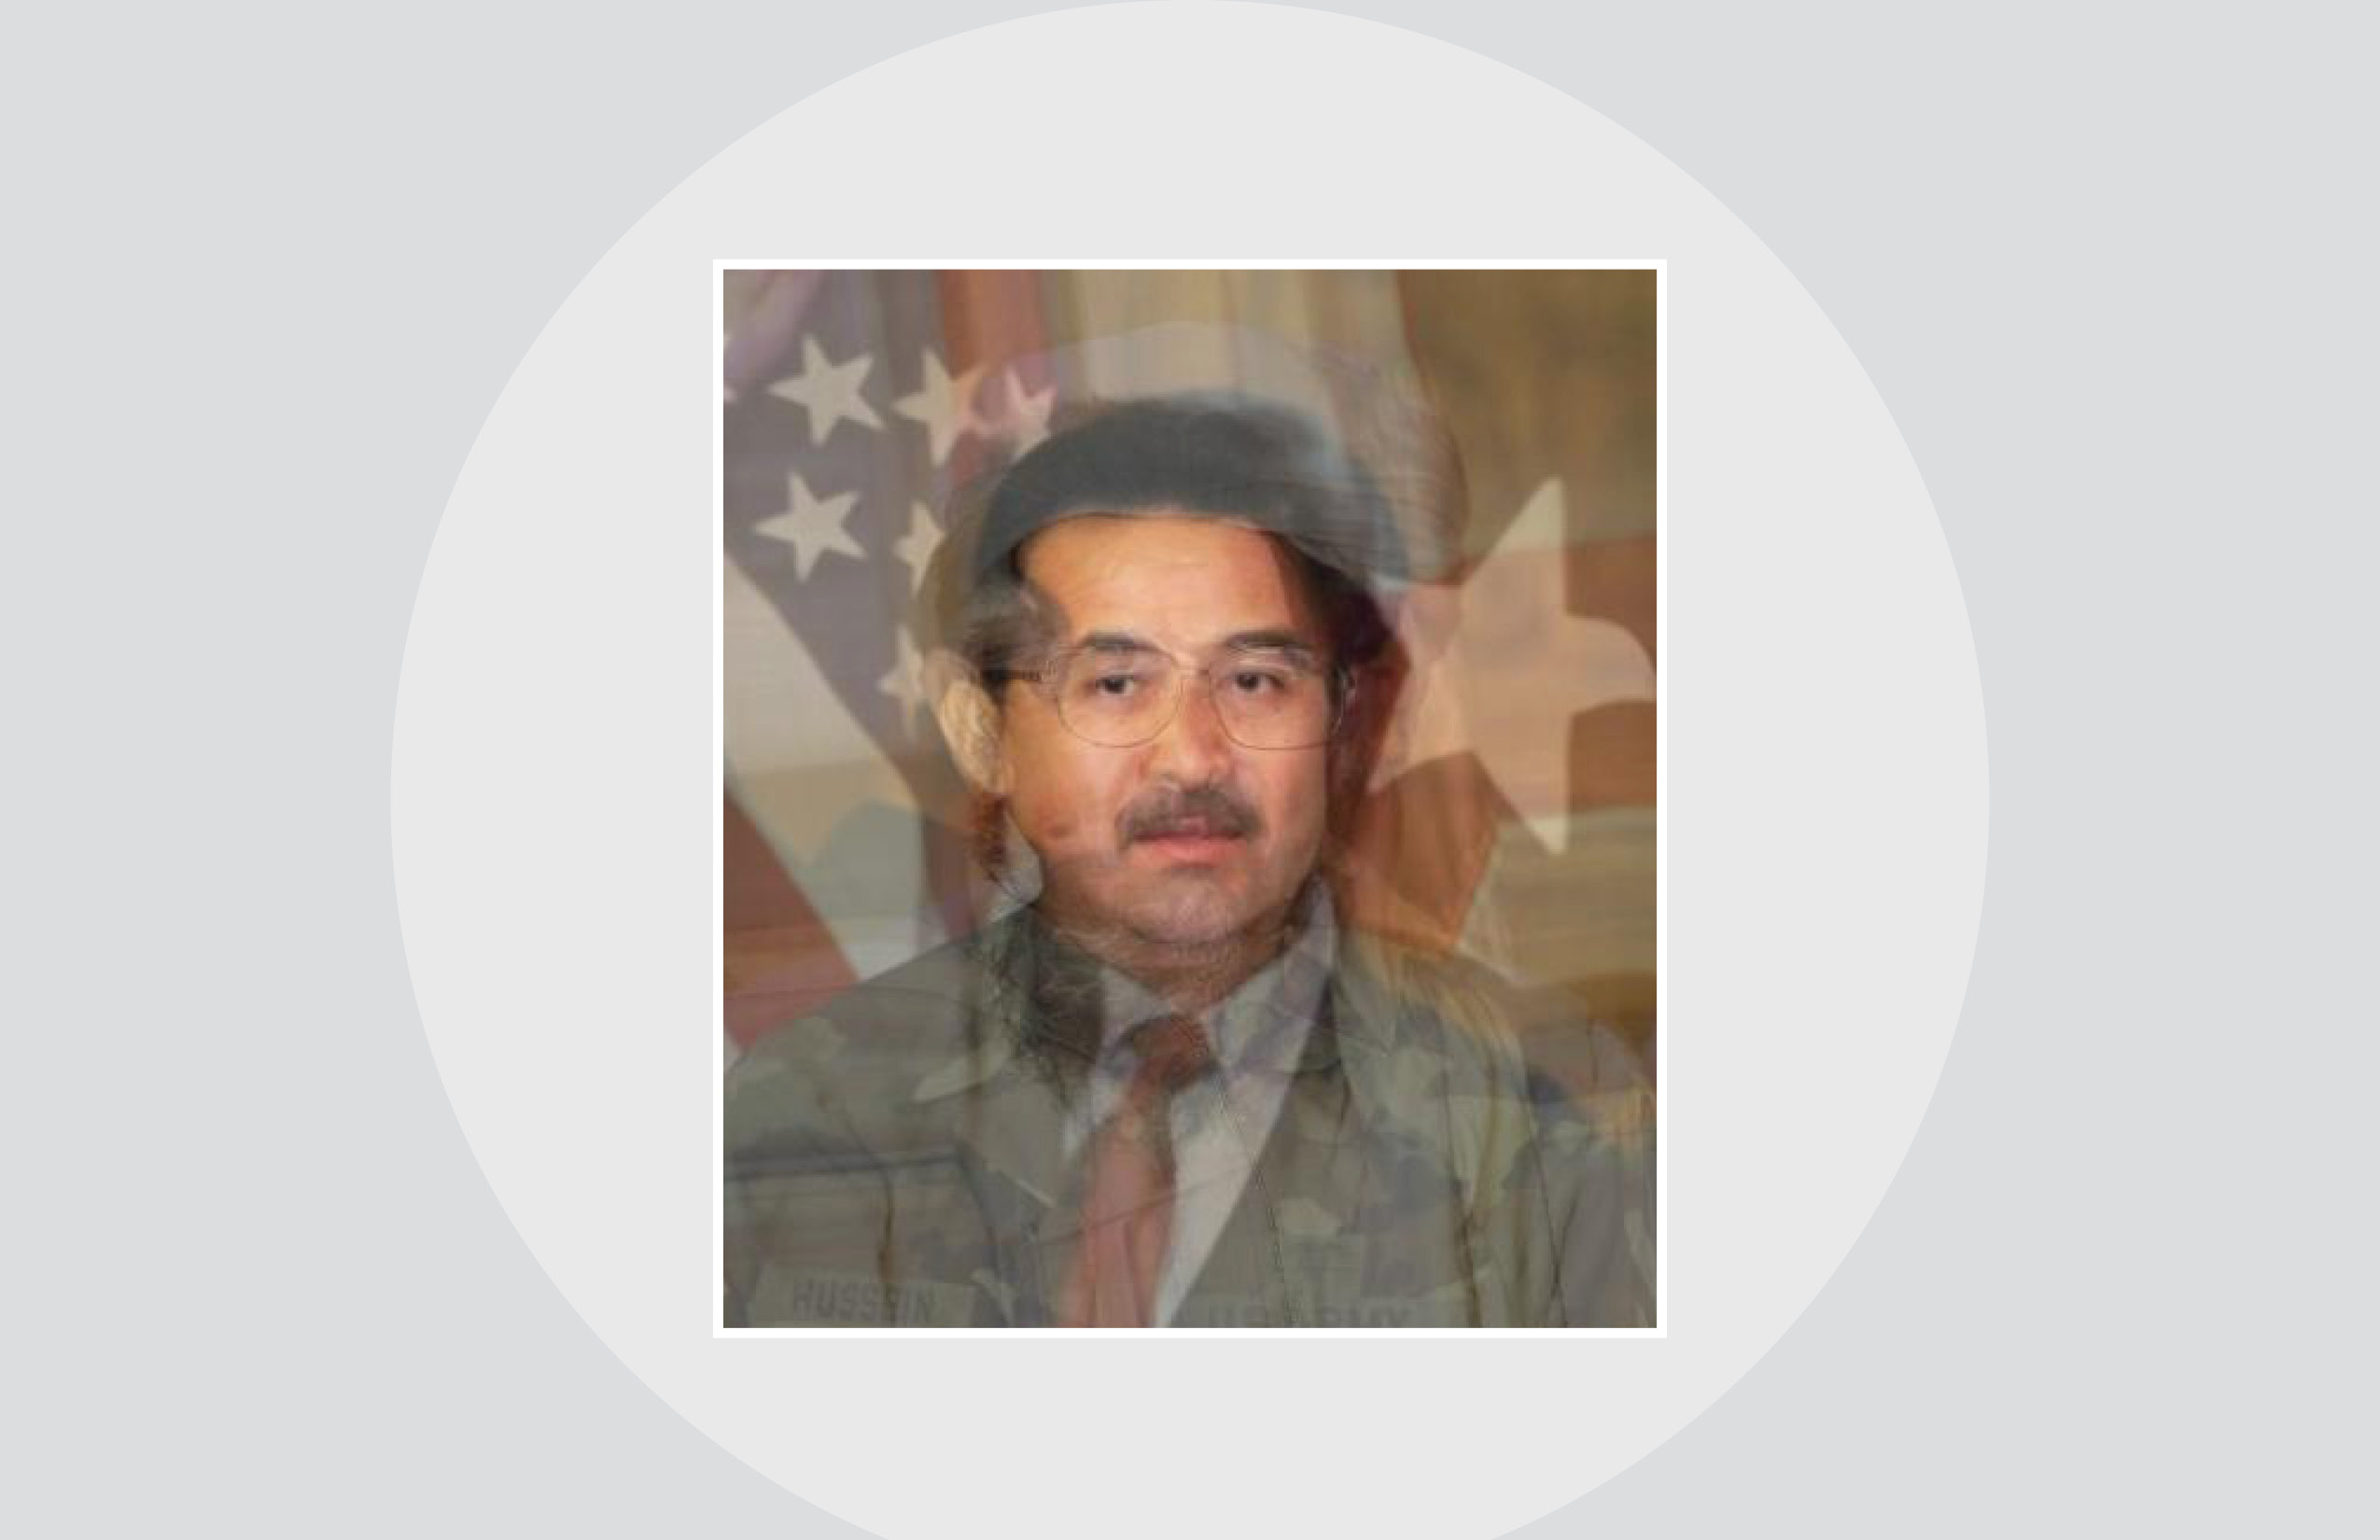
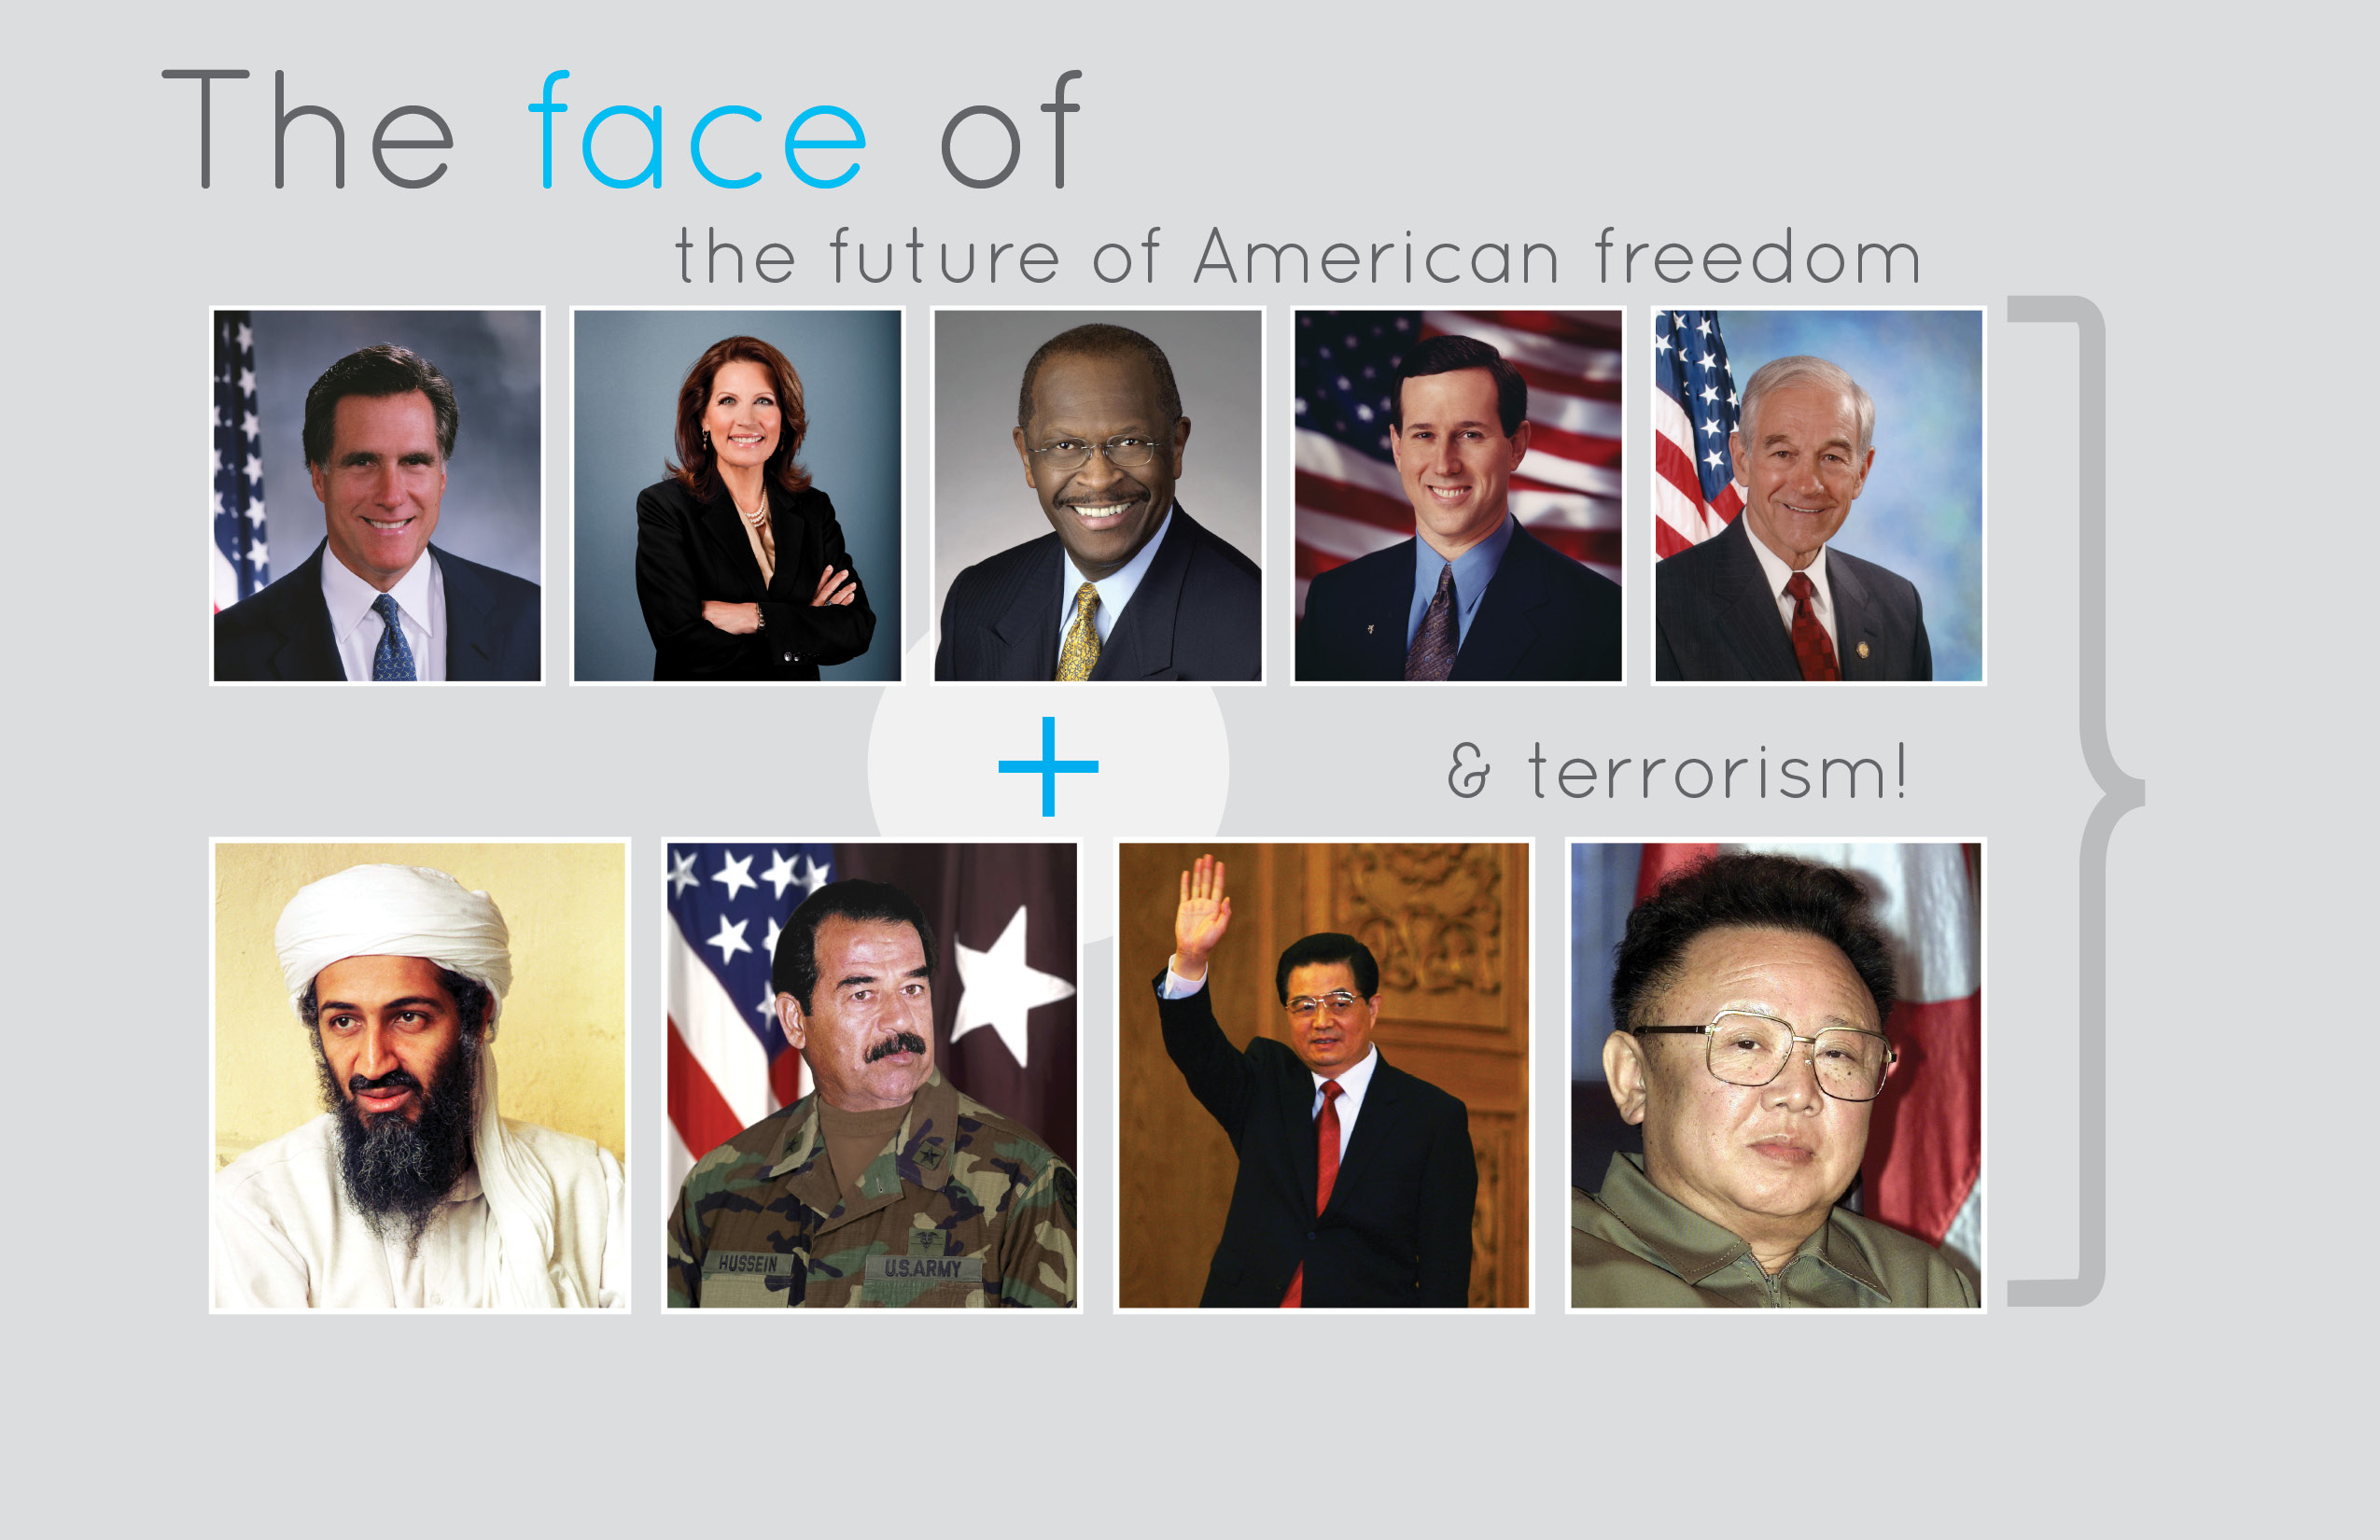
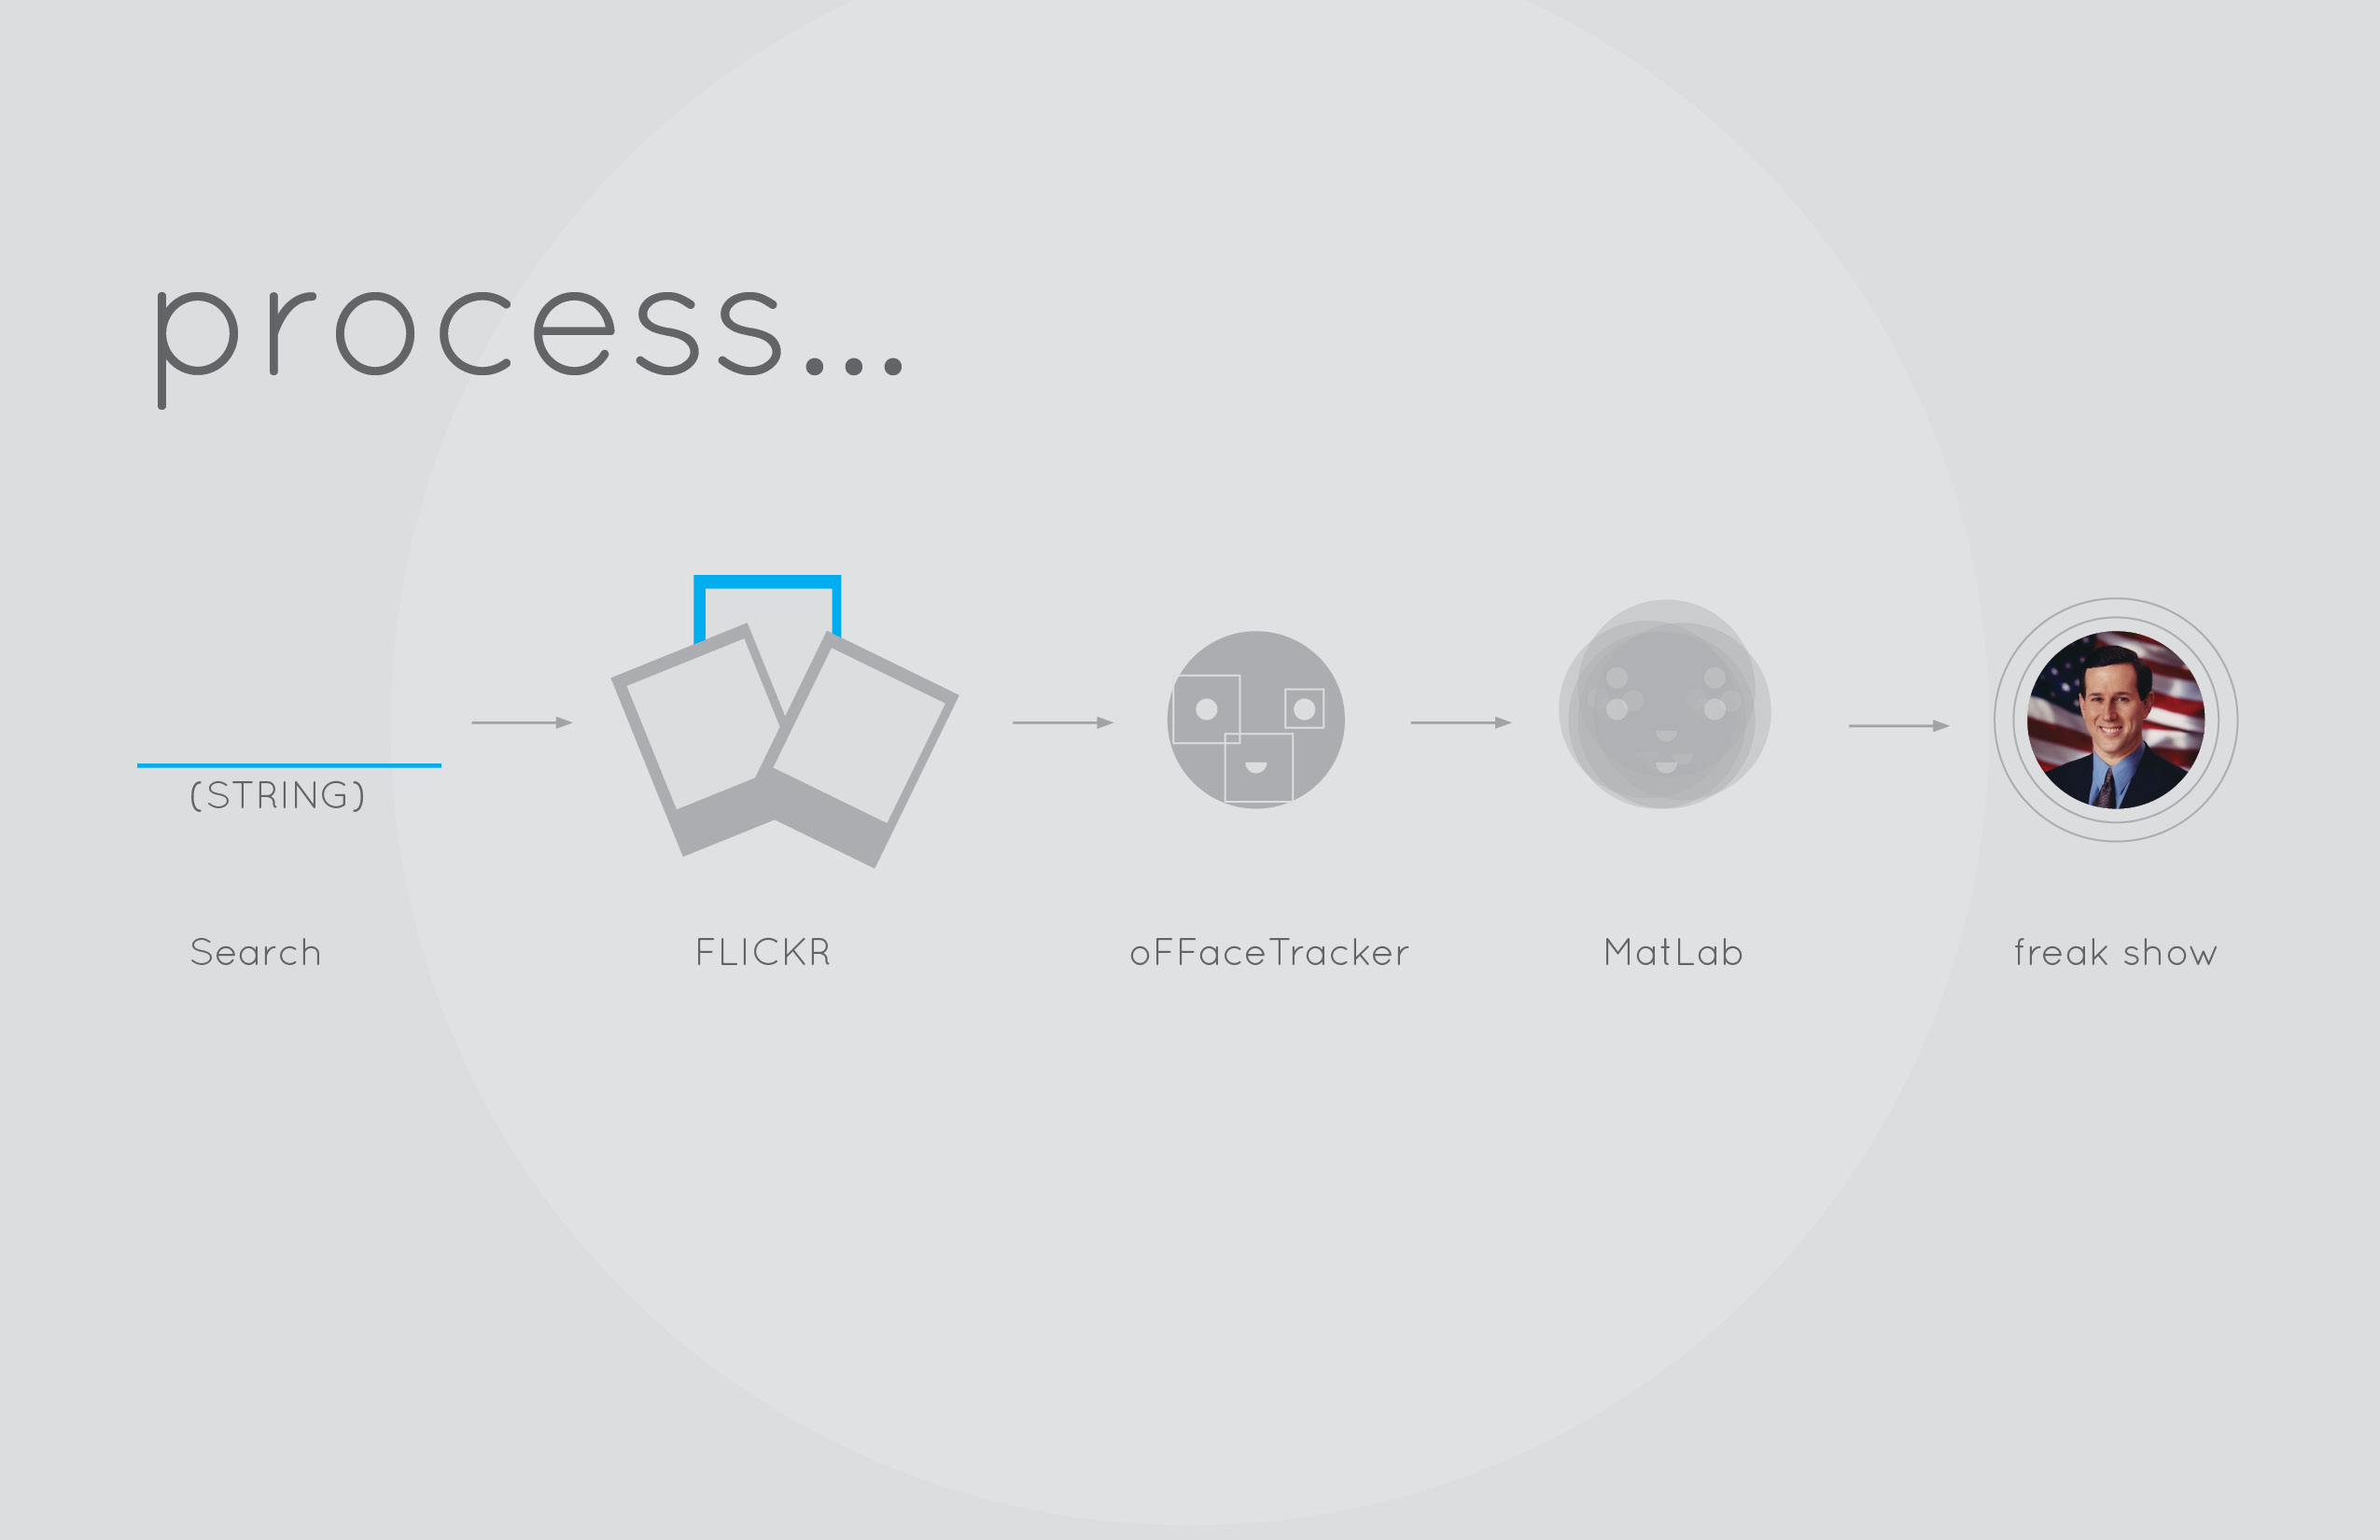
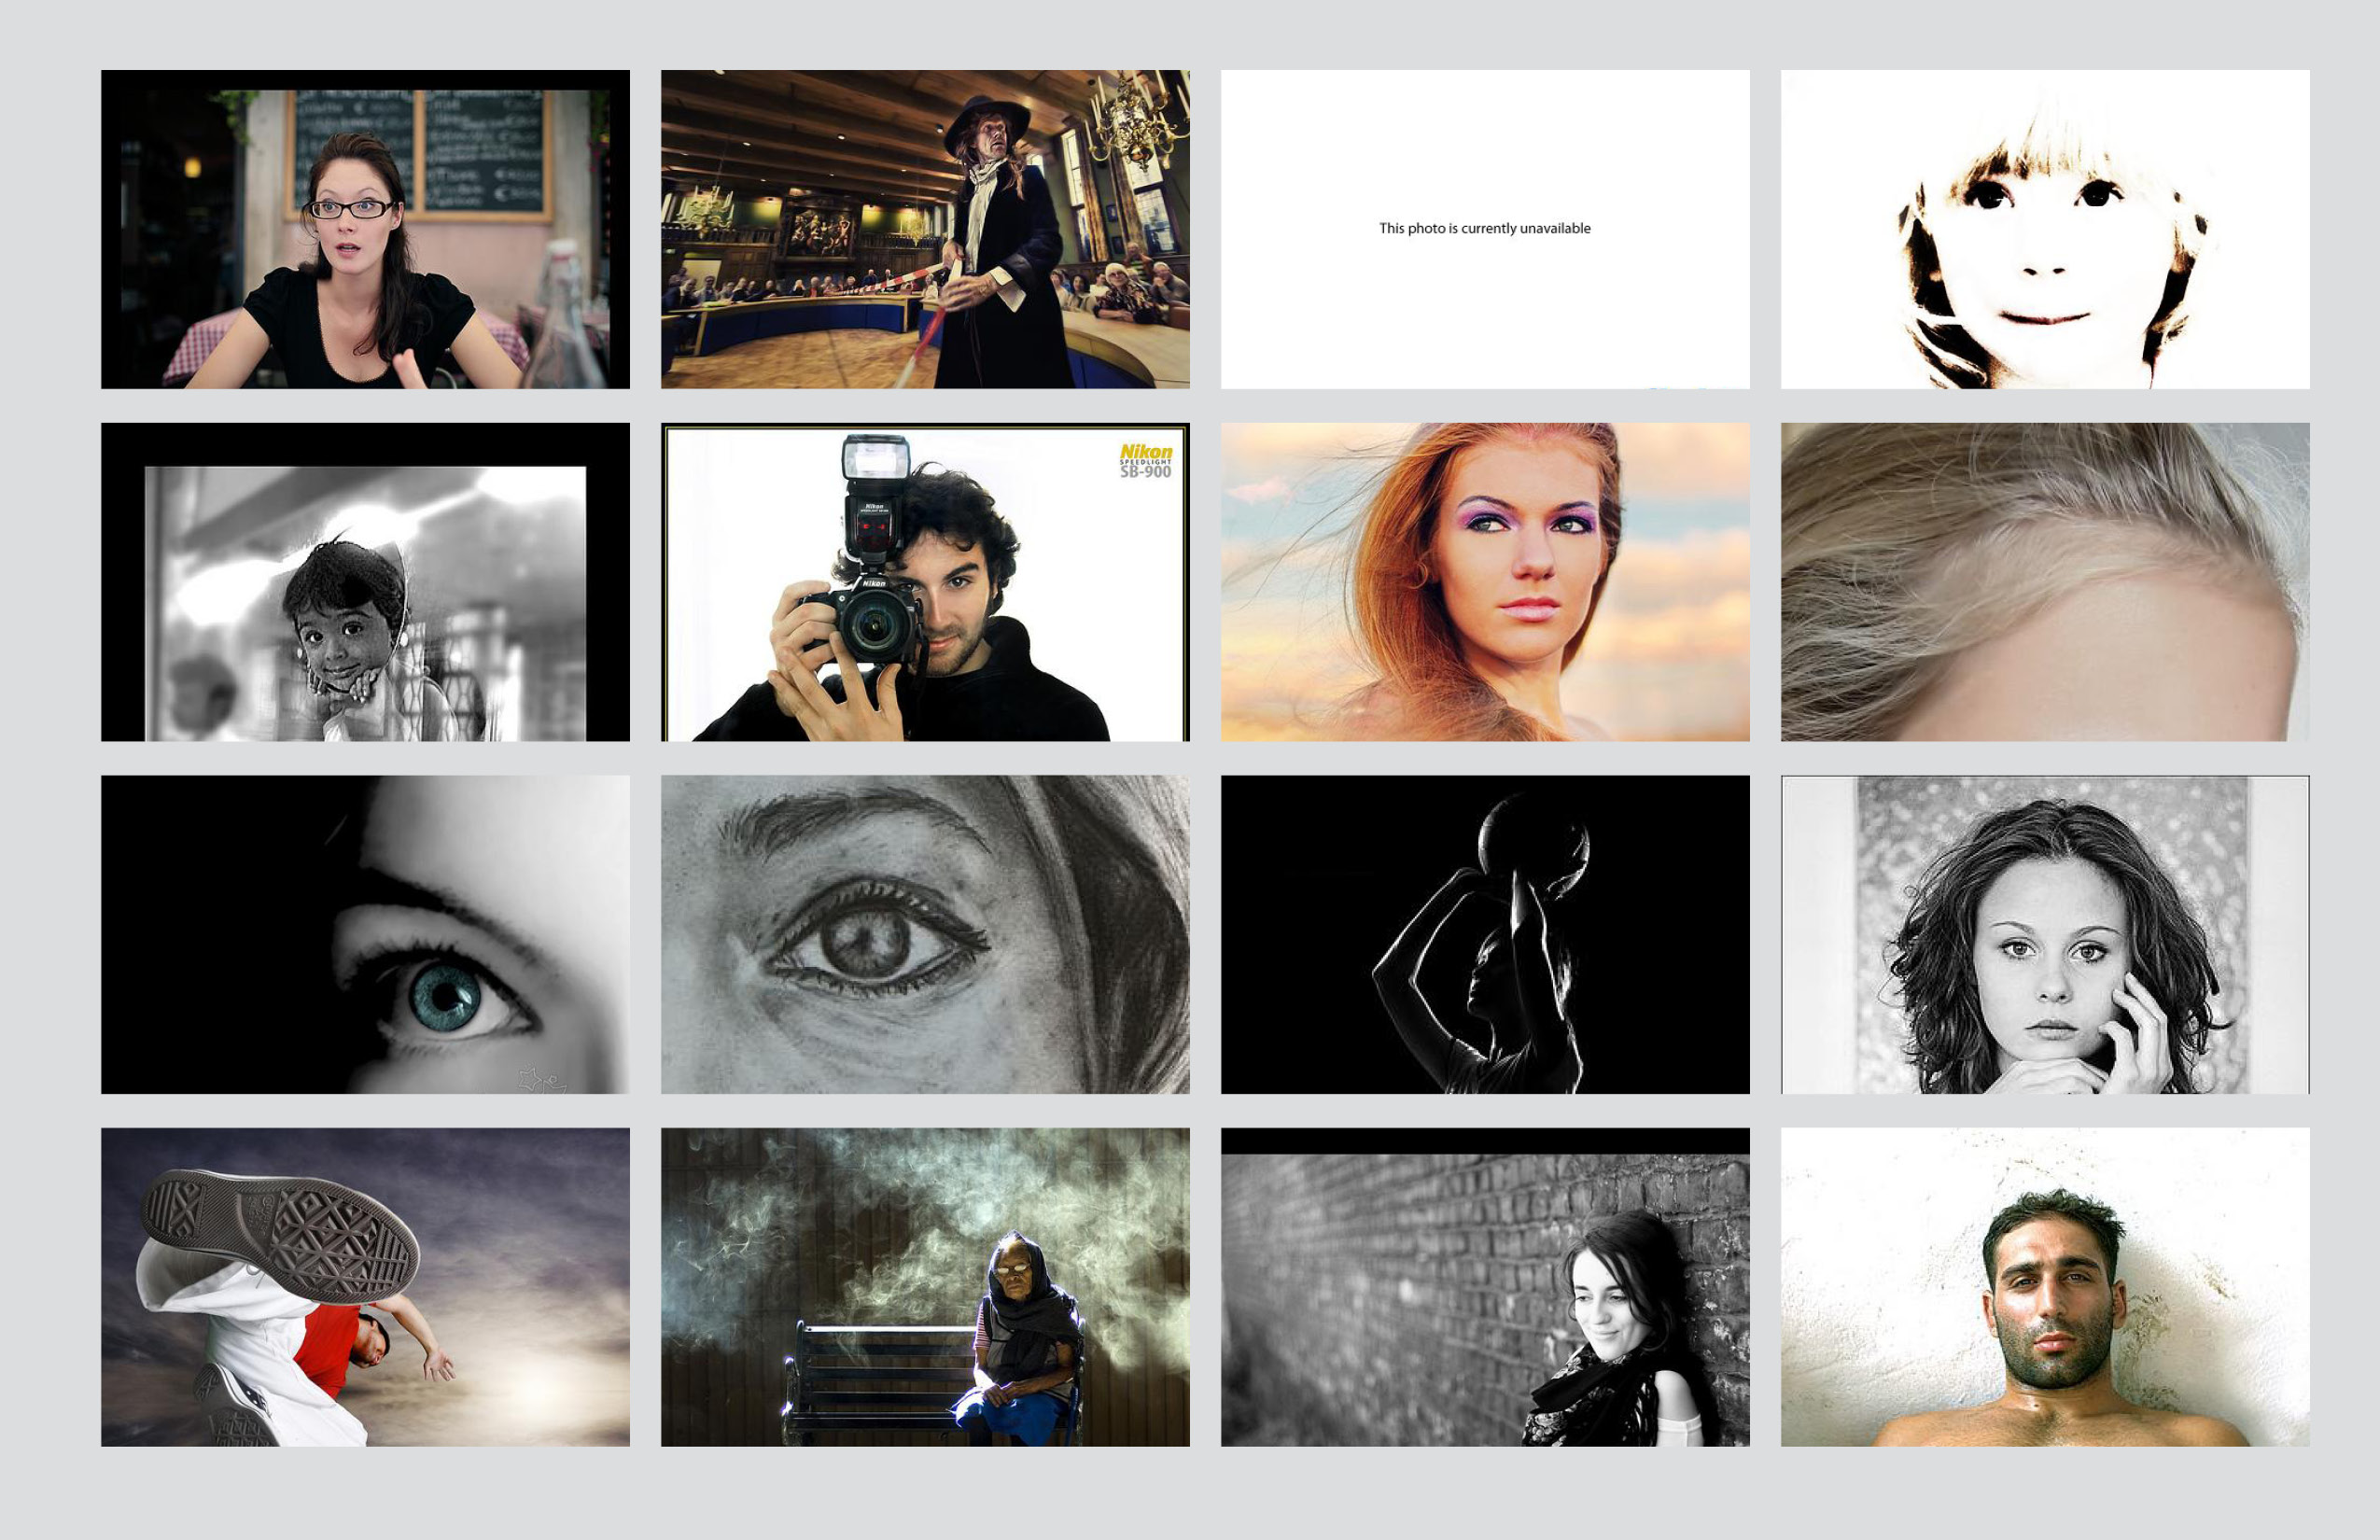
Therefore, I sought to explore another form of data visualization: face averaging. From the very beginning, I was somewhat obsessed with the concept of using averaging as a means of abstracting data whether it be the color of the sky or people’s faces. As my final idea, I sought to plug ambiguous words such as “success” and “money” into Flickr, scrape the resulting images, toss the images through Face Tracker  in OpenFrameworks, and finally average the faces in MatLab.

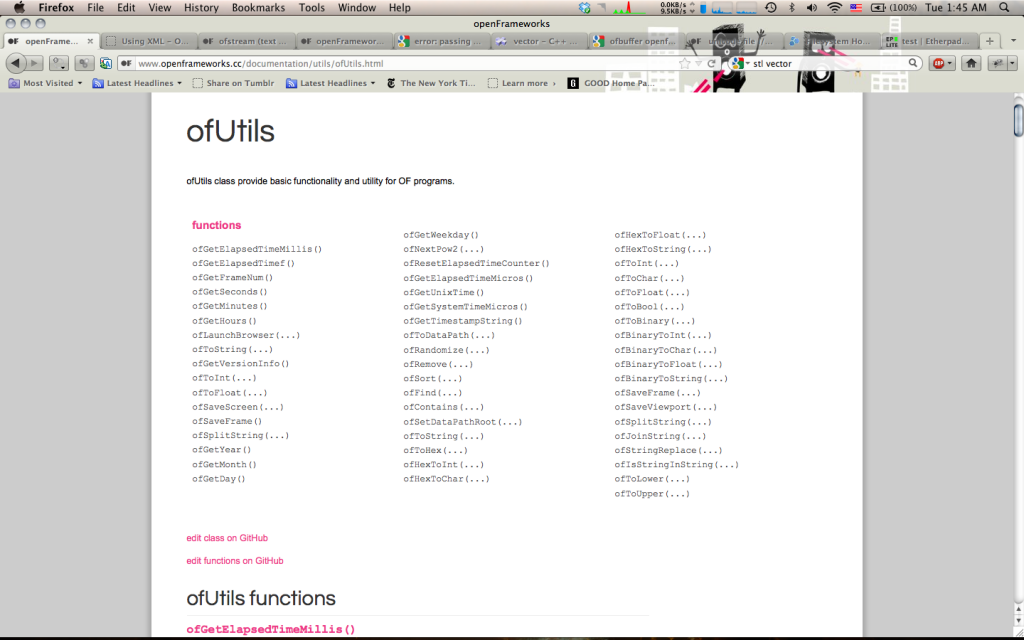
I’ll admit, for a novice Processing user, diving into OpenFrameworks, Face Tracker, and Flickr API simultaneously was quite daunting. I knew what I wanted to do and the general means of acheiving the goal, but the details escaped me. I had never really investigated the C++ programming language before and I wasn’t really sure how to implement the Flickr API.


Regardless I dove head first, writing (or rather copying) a Flickr scraper from the Processing forums.

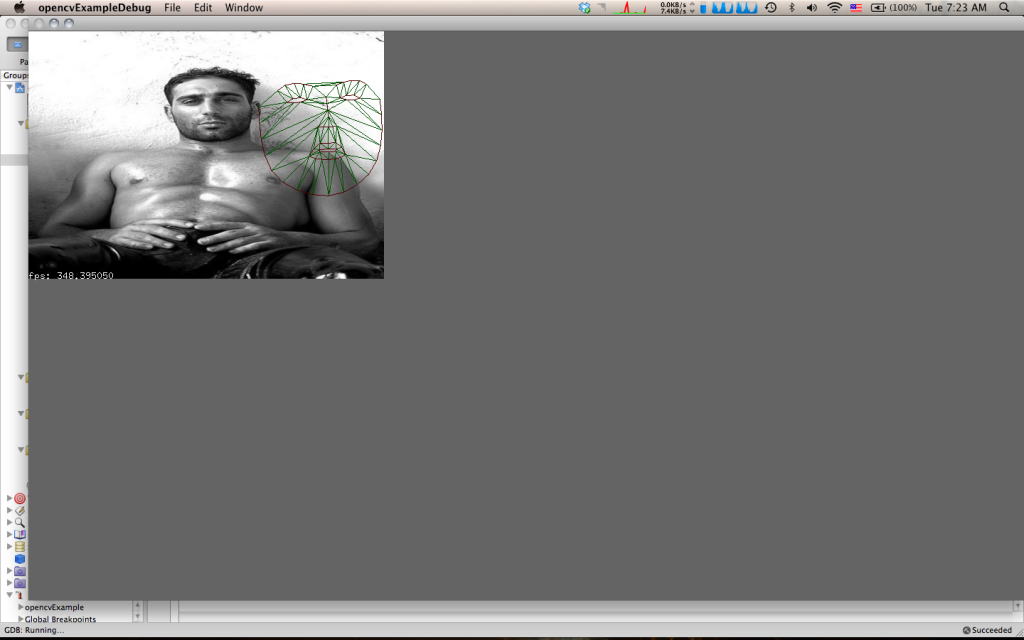
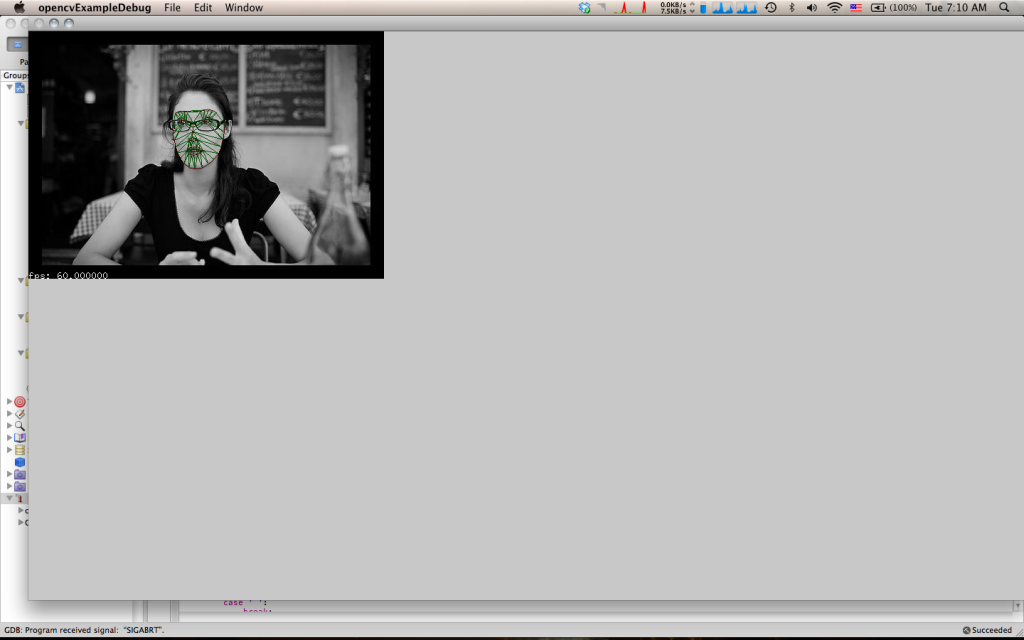
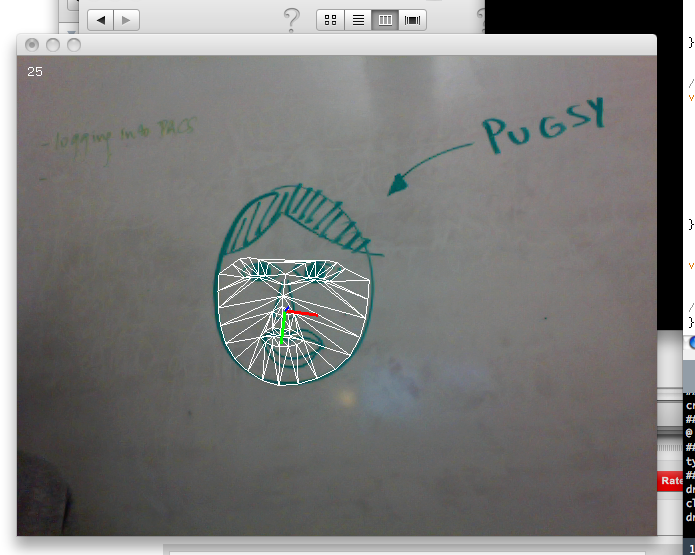
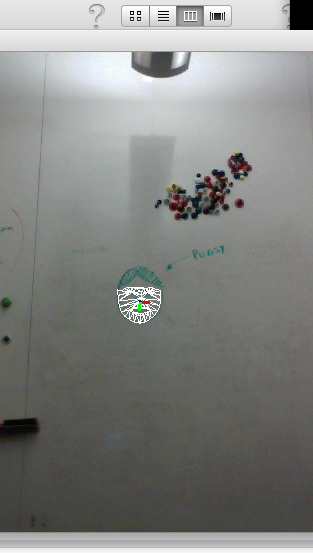
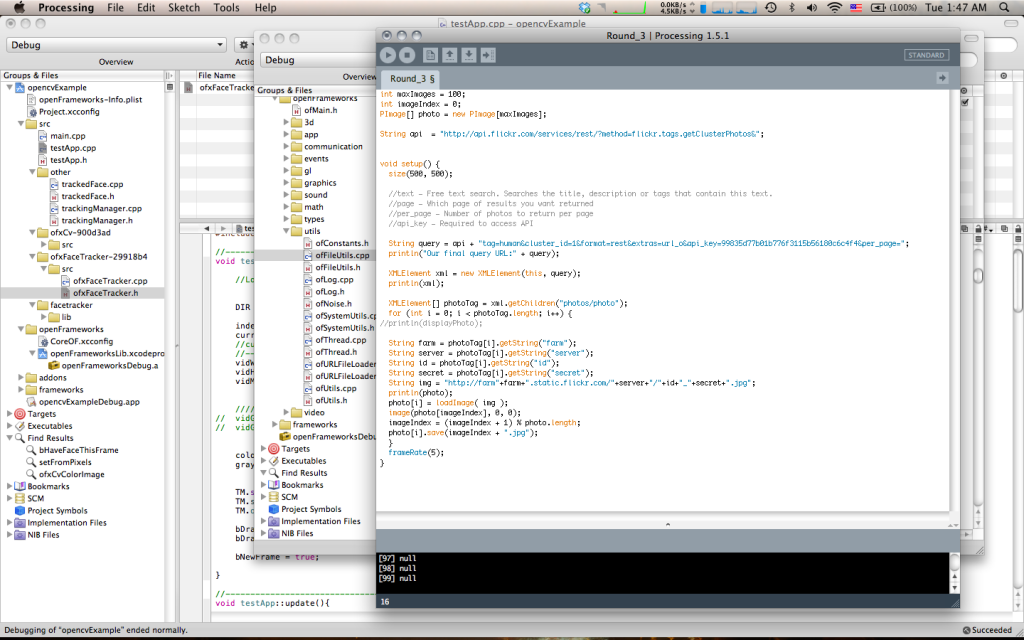
Once with my images, I headed into OpenFrameworks and immediately running into headaches with adding Addons in XCode 3 (which Max Hawkins assured me would have disappeared had I already installed XCode 4). Anyways logically, I knew I had to interrupt the video feed into Face Tracker with my own images, find where the points were being drawn and store those points in a .txt I could access later. It’s a lot easier than it sounds.

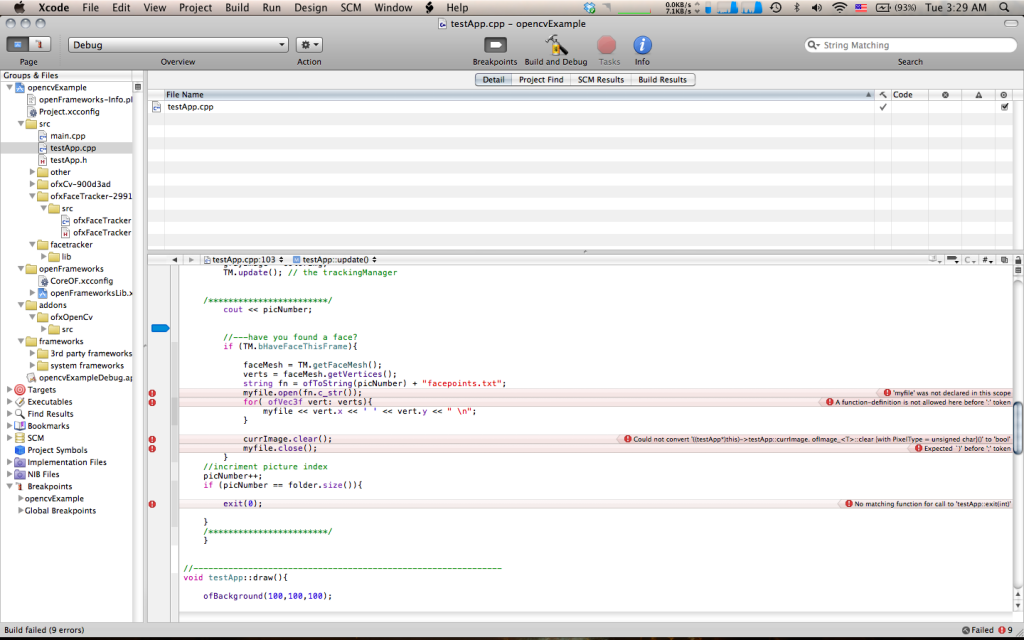
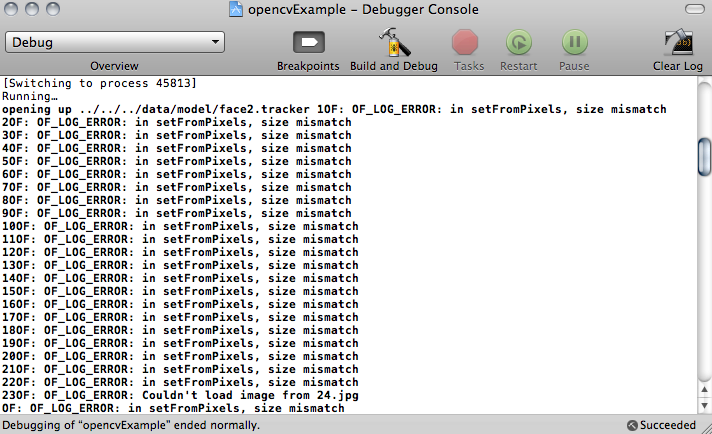
Every error that would appear, I would tried to decode it by either copy and pasting it into Google only to be greeted with more mumbo jumbo I didn’t understand, or I would constantly pester Alex Wolfe to lend me a helping hand (which graciously she did). Mostly, however, I struggled on my own as I really desired to at least understand the basic foundation of C++ and Openframworks.

There were essentially 3 major parts I had trouble with: reading the .jpg’s sequentially, getting Face Tracker to read the images, and outputting the plotted points to a .txt file. I ran into a numerous amount of logic errors, other errors that came and went… Essentially it was a hack job of me cutting and pasting, typing in random classes and types into the .h file and throwing them in the main .cpp file with the hopes that it would do something that I would want without making XCode too mad. Most of the time, I was frustrated by my lack of knowledge of the C++ language, severly hindering how much I could figure out on my own.

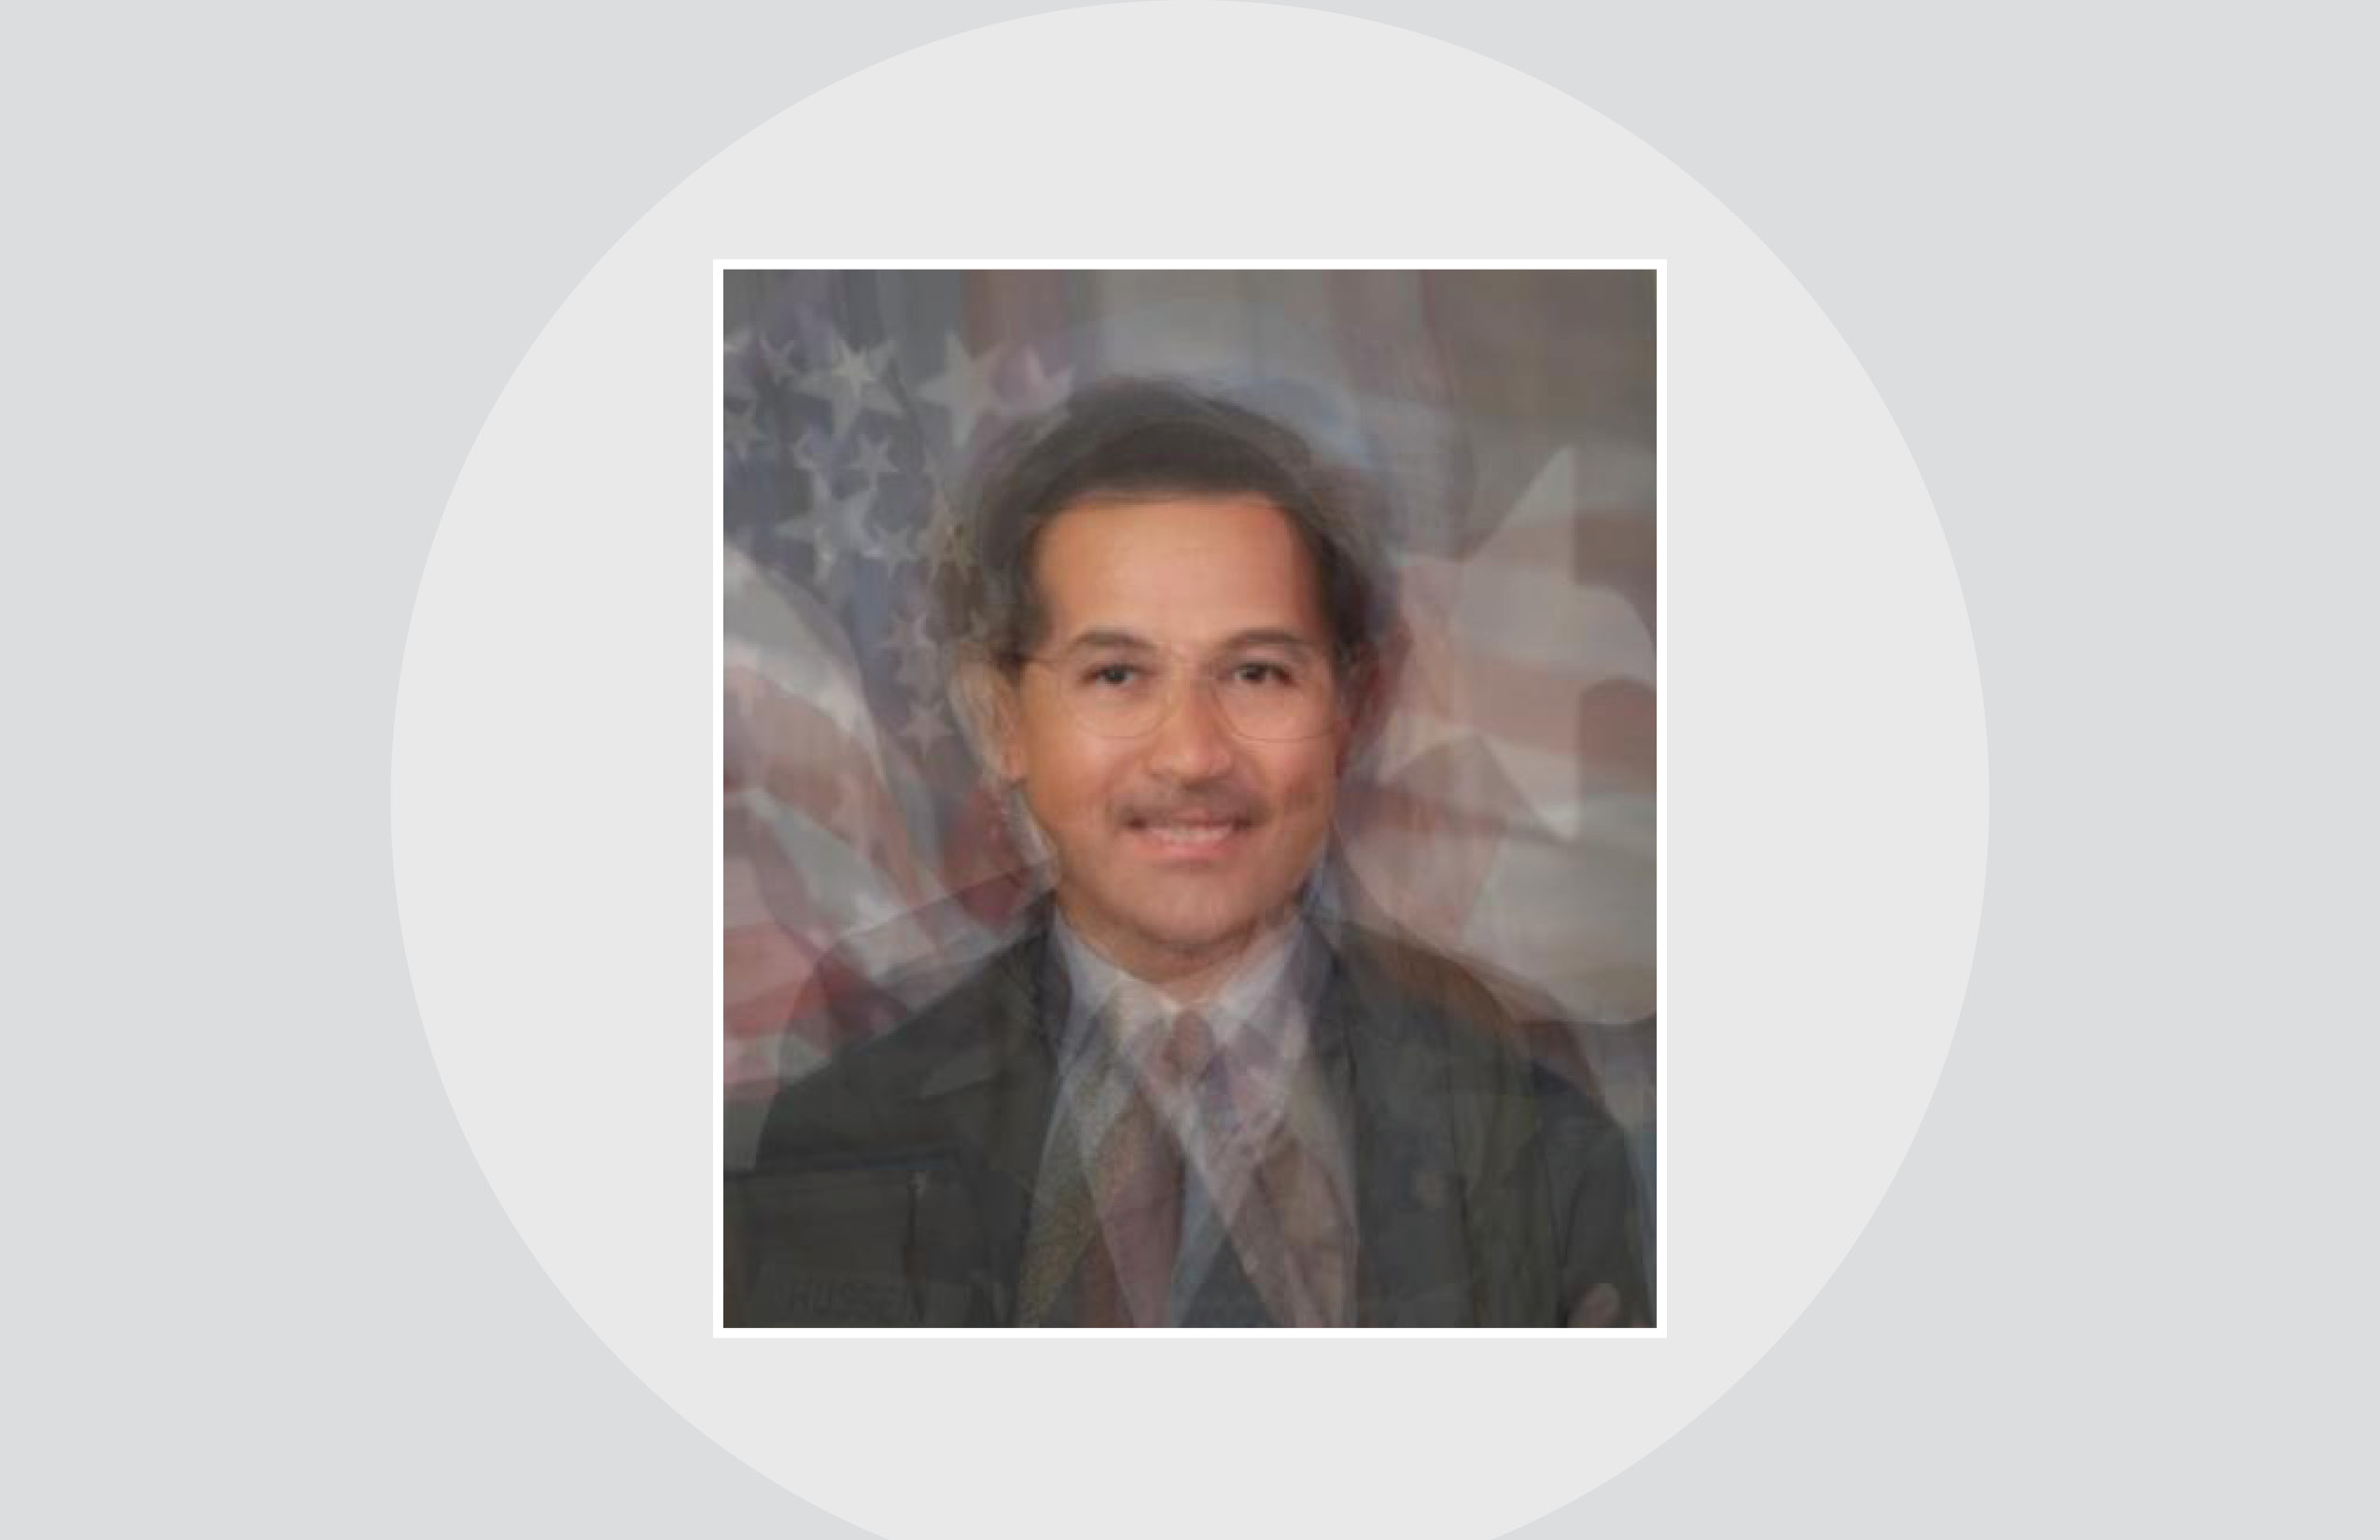
Finally, at 2:00am this morning, Alex and I, (mostly Alex) were able to wrangle Face Tracker to do our bidding and export everything very nicely. Unfortunately, once I threw my images into MatLab, things went to hell…again. I had anticipated this somewhat beforehand, but I really did not know how to work around it: Face Tracker is not wholly accurate, meaning 75% of the time, it would not filter images correctly and find faces randomly in the frames or fail to line up with the faces in the image in the first place. Of course this meant that the averaged face would look nothing remotely human or even like anything at all.

https://vimeo.com/36338138


Blase-LookingOutwards-2

by blase @ 7:14 am 31 January 2012

flickr flow

I really liked Fernanda Viega and Martin Wattenberg’s (him again!) Flickr Flow visualization. They took photos from Flickr taken in different months of the year at the Boston Common, plotting the relative proportion of different colors. Aesthetically, I think it’s a beautiful piece because of the flow of the different colors and their undulation. However, the really interesting part of Flickr Flow for me is the questions it raises about why people are taking the different photos, and what the relative rate of photo taking is during each season. During the winter, it seems that people are essentially taking pictures of the Common covered in snow, although I might assume there are fewer people taking photos than during the summer. I wish there were a concentric circle around the outer ring giving data on how many photos were analyzed for each time period, or, even better, posted on Flickr with metadata saying they were taken during that time.


language

Eric Fischer’s Language Communities of Twitter is very interesting to me because it visualizes a dataset that keeps some of the most interesting features hidden. He makes a world map with different colored dots placed on the world indicating language usage on Twitter, taken from the streaming API. The resultant map reveals both population density and Twitter usage. Features such as the English language usage by lots of people on the U.S. East coast, the nebulous blob of Moscow and its Russian usage, and clear Western European national boundaries that are divided by ethnicity are very clear. However, I thought it would be interesting to look for enclaves of languages indicating the presence of ethnic minorities in different areas. Unfortunately, these pockets are not visible in Eastern Europe or in parts of the U.S. as I would have hoped. Part of this lack of linguistic interestingness could be explained by the lack of Twitter usage in Eastern Europe, although I think the main issue is the plotting algorithm biasing towards the dominant language in an area.

Xing Xu-Looking Outwards-2

by xing @ 1:05 am

bit.code by von Julius Popp

The good thing about it is that I love the way that the abstract data is displayed in physical blocks and are continuously moving. And those patterns are not pretty readable. The artist said “Yes, this is one aspect, the other is that we as humans are only capable of reading and interpreting the letters of the alphabet, but in reality the code of the chains is like a barcode. For a machine, every part of this barcode is readable, for us it is just noise or random patterns. We can only deal with information that we have been taught or trained to read.” However, if the artwork has a pattern that the observer could recognize it will be better.

[youtube=http://www.youtube.com/watch?v=y7S6vMXZddQ]


»Enerugii Wa Antee Shite Inai (Unstable Energy)«  by Karsten Schmidt 2006

Advanced Beauty is an ongoing exploration of digital artworks born and influenced by sound, an ever-growing collaboration between programmers, artists, musicians, animators and architects.
………………………………………………………………………………………………………………………………………..
The first collection is a series of audio-reactive ‘video sound sculptures’.
Inspired by synasthesia, the rare sensory experience of seeing sound or tasting colours,
these videos are physical manifestations of sound, sculpted by volume, pitch or structure of the soundtrack.

I like the idea of different types of artists working together for a single project. And  the experience is deep in different perspectives. And the work explores space, sound, shape, color and animations in a very inseparable way. I could not tell how to improve it maybe in the future as the technology became better, the visual and sound will be even better.

[youtube=http://www.youtube.com/watch?v=aSbYLmd-bvg&feature=related]


Sarah Keeling; Looking Outwards 2

by sarah @ 1:51 pm 29 January 2012

Sweet Spot

Jonathans Gitelson created the data visualization “Sweet Spot” that shows where to stand on the train platform so that when the train stops, you would be conveniently right in front of the doors. The project consists of a diagram showing where the sweet spots are on the platform as well as a series of photographs of him standing in each “sweet spot”. The idea for the project came from his morning commute into Chicago and the struggle to get a seat on the train during the morning rush. I saw this piece at the Scottsdale Museum of Contemporary Art over the break and thought it might be interesting to look at for its concept and ideas of the different odd data that can be visualized. I think that his approach of making the diagram by hand is unique, but that the way he formatted the information could be done in a different way that would convey the information more effectively.

http://www.thegit.net/sweet_spot

Map of Scientific Collaboration Between Researchers

Oliver Beauchesne created a data visualization that mapped where scientific collaborators were from through 2005 to 2009. He got the idea to do so from the Facebook friendship map and decided to make a similar one with a data set from his work. I think it shows interesting patterns and groupings of collaborations that would otherwise not really be known. I also think that data removed, it is a beautiful image and that the abstraction of the map adds to its interest.

http://www.visualcomplexity.com/vc/project_details.cfm?id=747&index=747&domain=

20 Hz

20 Hz was made by Ruth Jarman and Joe Gerhardt (known as Semiconductor) in 2011 and is a bit of a different approach to data visualization than some of the example we have been looking at. They use radio data (captured at 20 Hz) gathered from a geo-magnetic storm in Earth’s upper atmosphere as the audio for the piece. The changes in the sound then generates the visual forms and patterns that appear.

Alex Wolfe | Gauntlet | Frieder Nake

by a.wolfe @ 4:38 am 26 January 2012

import processing.opengl.*;

/*Alex Wolfe | Gauntlet*/

//Globals, adjust to edit nitpicky params
//Circles
int numCirc = 4;
int circMax = 100;
int circMin = 10;
//GridLines
int minRowSpace = 50;
int maxRowSpace = 100;
int minColSpace = 30;
int maxColSpace;
int minCols = 8;
int maxCols = 20;
int numrows, numcols;
int linewaver = 8;
int[] colSpace;
boolean[][] gridCheck;

//Lines
int minLines = 10;
int maxLines = 20;

RowLine[] grid;

void setup() {
  size(600, 600, P2D);
  background(255);
  smooth();
  strokeWeight(0.5);
  strokeCap(ROUND);
  noFill();
  stroke(0);

  //init colSpace grid
  int j =0;
  numcols = int(random(minCols, maxCols));
  maxColSpace = width/numcols;
  colSpace = new int[numcols];
  for (int i=0; i<numcols-1; i++) {
    colSpace[i] = j;
    if (j<width) {
      j = j+int(random(minColSpace, maxColSpace));
    }
    else {
      j = j+int(random(min(minColSpace, width-j), max(minColSpace, width-j)));
    }
  }
  colSpace[numcols-1] = width;

  /*********init***************/
  initGrid(); 
  drawCircles();

  for (int i=0; i<grid.length; i++) {
    grid[i].drawLine();
  }

  gridCheck = new boolean[numrows][numcols];
  drawLines();
  /************DeBug************/
  println("numrows = " + numrows + " numcols =" + numcols);
  println("colSpace array");
  for (int k = 0; k<colSpace.length; k++)
    print(colSpace[k] + " ");
  println();
  println();
  /* for(int i=0; i<grid.length; i++){
   for( j=0; j<numcols; j++){
   print("(" + grid[i].segPoints[j].x + ", " + grid[i].segPoints[j].y + " ), ");
   }
   println(" /" + i);*/
  /****************************/
}

void mouseClicked() {
  background(255);
  initGrid(); 
  numCirc = int(random(3, 7));
  drawCircles();

  for (int i=0; i<grid.length; i++) {
    grid[i].drawLine();
  }
  drawLines();
}

void draw() {
}

void initGrid() {
  int y = int(random(minRowSpace, maxRowSpace));
  numrows = int(random(8, 12));
  grid = new RowLine[numrows];

  grid[0] = new RowLine(0);
  for (int i=1; i<numrows-1; i++) {
    grid[i] = new RowLine(y);
    if (y<height) {
      y = y+int(random(minRowSpace, maxRowSpace));
    }
    else {
      y = y+int(random(min(minRowSpace, height-y), max(maxColSpace, height-y)));
    }
  }
  grid[numrows-1] = new RowLine(height);
}

void drawLines() {
  float flip;
  for (int col=0; col<numcols-1; col++) {
    for (int row=0; row<numrows-1; row++) {
      flip = random(14);
      if (flip <4)
        drawVertLines(row, col);
      else if (flip <8)
        drawCrazyLines(row, col);
        }
      }
    }

    void drawCrazyLines(int row, int col)
    {
      int numLines = int(random(minLines, maxLines));
      float p1x = grid[row].segPoints[col].x;
      float p1y = grid[row].segPoints[col].y;
      float p2x = grid[row].segPoints[col+1].x;
      float p2y = grid[row].segPoints[col+1].y;
      float p3x = grid[row+1].segPoints[col].x;
      float p3y = grid[row+1].segPoints[col].y;
      float p4x = grid[row+1].segPoints[col+1].x;
      float p4y = grid[row+1].segPoints[col+1].y;

      float slope1 = (p2y-p1y)/(p2x-p1x);
      float slope2 = (p3y-p4y)/(p3x-p4x);

      for (int i=0; i<numLines; i++) {
        float x1= random(p1x, p2x);
        float x2= random(p1x, p2x);
        stroke(0);
        line(x1, (slope1*(x1-p1x)+p1y), x2, slope2*(x2-p3x)+p3y);
      }
    }
void drawVertLines(int row, int col) {
  int numLines = int(random(minLines, maxLines));

  float p1x = grid[row].segPoints[col].x;
  float p1y = grid[row].segPoints[col].y;
  float p2x = grid[row].segPoints[col+1].x;
  float p2y = grid[row].segPoints[col+1].y;
  float p3x = grid[row+1].segPoints[col].x;
  float p3y = grid[row+1].segPoints[col].y;
  float p4x = grid[row+1].segPoints[col+1].x;
  float p4y = grid[row+1].segPoints[col+1].y;

  float slope1 = (p2y-p1y)/(p2x-p1x);
  float slope2 = (p3y-p4y)/(p3x-p4x);

  for (int i=0; i<numLines; i++) {
    float x= random(p1x, p2x);
    stroke(0);
    line(x, (slope1*(x-p1x)+p1y), x, slope2*(x-p3x)+p3y);
  }
}

Circle[] circles;
boolean good = false;

void drawCircles() {
  circles = new Circle[numCirc];
  for (int i=0; i< numCirc; i++) {
    good = false;
    while (circles[i] == null) {
      circles[i] = createCircle(i);
    }
  }    
  for (int j=0; j<circles.length; j++)
    ellipse(circles[j].x, circles[j].y, circles[j].rad, circles[j].rad);
}
Circle createCircle(int i) {
  boolean fail = false;
  float dim = random(circMin, circMax);
  Circle test = new Circle(random(circMax, width-circMax), random(circMax, height-circMax), dim);
  //circles[i] = test;
  for (int j=0; j<i; j++) {
    if (circleHitTest(test, circles[j])) {
      return null;
    }
  }
  return test;
}

boolean circleHitTest(Circle c1, Circle c2) {
  float hitRad = c1.rad + c2.rad;
  if ( dist(c1.x, c1.y, c2.x, c2.y) < hitRad)
    return true;
  else
    return false;
}


class RowLine{
  PVector[] segPoints;
  int rowStart;
 // RowLine prev, next;
  
  public RowLine(int rowStart1){
    segPoints = new PVector[numcols];
    rowStart=rowStart1;
    
    if( (rowStart == 0) || (rowStart == height))
      initEdgeLine();
    else
      initLine();
  }
  
  void initLine(){
    int x,y;
    y= rowStart;
    for(int i=0; i<numcols; i++){
      segPoints[i] = new PVector(colSpace[i], y);
      y= y + int(random(-linewaver, linewaver));
    }
  }
  
  void initEdgeLine(){
    int x,y;
    y= rowStart;
    for(int i=0; i<numcols; i++){
      segPoints[i] = new PVector(colSpace[i], y);
    }
  }
  
  void drawLine(){
    stroke(0);
    //smooth();
    strokeWeight(0.5);
    strokeJoin(MITER);
    beginShape();
    for(int i=0; i<segPoints.length; i++)
      vertex(segPoints[i].x, segPoints[i].y);
    endShape();
   // for(int i=0; i<segPoints.length-1; i++){
      //line(segPoints[i].x, segPoints[i].y, segPoints[i+1].x, segPoints[i+1].y);
   // }
  }
}

Rothera-howSupermanFlys

by alex @ 10:06 am 24 January 2012

Why doesn't Superman blink?

I created a game that would more realistically portray superman’s ability to fly.

FaceOsc recognizes smiley faces

by mahvish @ 10:00 am

:) It works pretty consistently.

Some samples:

-m

Xing Xu-13-9-65

by xing @ 7:54 am

void setup() {

size(860, 860);

strokeWeight( 1.2 );
smooth();
background (255);
for (int i = 0; i < 8; i = i+1) {
float radius=random(0,300);
ellipse(random(0,860), random(0,860), radius,radius);
}

float x=0,y=0,a,b;
float[] xarray=new float[1000];
float[] yarray=new float[1000];
int linepoint=0,count=0;
for (int i = 0; i < 8; i = i+1) {
count=0;
y=y+random(0,200);
x=0;
while (x<860){
count=count+1;
a=x+random(0,120);
b=y+random(-10,10);
line(x,y,a,b);
x=a;y=b;
xarray[count]=x;
yarray[count]=y;
if (i>0)
{
if (random(0,3)>2.2)
{
linepoint=int(random(0,19));
line(xarray[linepoint],yarray[linepoint],x,y);
}

if (random(0,3)<1.3)

line(x,yarray[linepoint],x,y);

}
}
}
}

void draw(){


}

void mousePressed() {

strokeWeight( 1.2 );
smooth();
background (255);
for (int i = 0; i < 8; i = i+1) {
float radius=random(0,300);
ellipse(random(0,860), random(0,860), radius,radius);
}

float x=0,y=0,a,b;
float[] xarray=new float[1000];
float[] yarray=new float[1000];
int linepoint=0,count=0;
for (int i = 0; i < 8; i = i+1) {
count=0;
y=y+random(0,200);
x=0;
while (x<860){
count=count+1;
a=x+random(0,120);
b=y+random(-10,10);
line(x,y,a,b);
x=a;y=b;
xarray[count]=x;
yarray[count]=y;
if (i>0)
{
if (random(0,3)>2.2)
{
linepoint=int(random(0,19));
line(xarray[linepoint],yarray[linepoint],x,y);
}

if (random(0,3)<1.3)

line(x,yarray[linepoint],x,y);

}
}
}

}


Duncan Boehle – 13-9-65

by duncan @ 4:59 am

This is my attempt at generating pieces of art that follow the convents of Frieder Nake’s work 13/9/65. Press any key to continually generate more random versions.

//
// Duncan Boehle
// Emulation of 13/9/65 - Nake
//
 
int minCols = 6;
int maxCols = 8;
int minRows = 8;
int maxRows = 12;
int minCircles = 4;
int maxCircles = 8;
int minRadius = 3;
int maxRadius = 50;
float vertProb = 0.25f;
float crossProb = 0.35f;
int sideSize = 550;
int sideBuffer = 8;
 
ArrayList heightRows;
 
// ArrayList of rows, which is length "rows", and each
// element is an ArrayList of length "cols"
// each element of this inner ArrayList is a Box
Box[][] boxes;
 
int numRows;
int numCols;
int[] colMinXs;
int[] rowStartYs;
 
ArrayList circles;
 
void setup() {
  size(566, 566);
  smooth();
  stroke(0);
  strokeWeight(1.5);
  noFill();
 
  drawNake();
}
 
public void drawNake() {
 
  background(255);
 
  heightRows = new ArrayList();
  numRows = int(random(minRows, maxRows));
  numCols = int(random(minCols, maxCols));
  boxes = new Box[numRows][numCols];
 
  colMinXs = makePosArray(numCols, sideBuffer, sideSize + sideBuffer, 1.0f, 3.0f);
  rowStartYs = makePosArray(numRows, sideBuffer, sideSize + sideBuffer, 1.0f, 2.5f);
 
  for (int y = 0; y &lt;= numRows; y++) {
    ArrayList row = new ArrayList();
    int rowHeight = y &lt; numRows ? rowStartYs[y] : (sideSize + sideBuffer);
    row.add(rowHeight);
    for (int x = 0; x  0 &amp;&amp; y &lt; numRows) {
        rowHeight += int(random(-12, 12));
      }
      row.add(rowHeight);
    }
 
    heightRows.add(row);
  }
 
  rect(sideBuffer, sideBuffer, sideSize, sideSize);
 
  for (int y = 0; y &lt; numRows; y++) {
    ArrayList topRowHeightRow = (ArrayList)heightRows.get(y);
    ArrayList botRowHeightRow = (ArrayList)heightRows.get(y + 1);
    for (int x = 0; x &lt; numCols; x++) {
      int minX = colMinXs[x];
      int maxX = (x &lt; numCols - 1) ? colMinXs[x + 1] : (sideSize + sideBuffer);
      int ulY = (Integer)topRowHeightRow.get(x);
      int urY = (Integer)topRowHeightRow.get(x + 1);
      int blY = (Integer)botRowHeightRow.get(x);
      int brY = (Integer)botRowHeightRow.get(x + 1);
 
      line(minX, ulY, maxX, urY);
      //line(minX, ulY, minX, blY);
      //line(maxX, urY, maxX, brY);
      line(minX, blY, maxX, brY);
 
      float rand = random(0.0f, 1.0f);
      int type = Box.TYPE_EMPTY;
      if (rand &lt; vertProb)
        type = Box.TYPE_VERTICAL;
      else if (rand  0) {
        Box boxAbove = boxes[y - 1][x];
        if (type == Box.TYPE_VERTICAL &amp;&amp; boxAbove.type == Box.TYPE_VERTICAL) {
          newBox = boxAbove;
        }
      }
 
      if (newBox == null) {
        newBox = new Box(type, int(random(1, 5)));
      }
      newBox.draw(minX, maxX, ulY, urY, blY, brY);
      boxes[y][x] = newBox;
    }
  }
 
  int numCircles = int(random(minCircles, maxCircles));
  circles = new ArrayList();
  for (int i = 0; i &lt; numCircles; i++) {
    int rad = int(random(minRadius, maxRadius));
    int x = int(random(2 * sideBuffer + rad, sideSize - rad));
    int y = int(random(2 * sideBuffer + rad, sideSize - rad));
    Circle circle = new Circle(x, y, rad);
 
    boolean intersects = false;
    for (int c = 0; c &lt; circles.size(); c++) {
      Circle otherCircle = (Circle)circles.get(c);
      if (circle.intersects(otherCircle)) {
        intersects = true;
        break;
      }
    }
 
    if (!intersects) {
      circles.add(circle);
      ellipse(x, y, rad * 2, rad * 2);
    }
  }
}
 
public int[] makePosArray(int num, int minN, int maxN, float minRat, float maxRat) {
  float[] ratioList = new float[num];
  float totalRat = 0.0f;
  for (int i = 0; i &lt; num; i++) {
    float ratio = random(minRat, maxRat);
    ratioList[i] = ratio;
    totalRat += ratio;
  }
 
  int curN = minN;
  int[] pixelList = new int[num];
  for (int i = 0; i &lt; num; i++) {
    pixelList[i] = curN;
    float ratio = ratioList[i];
    ratio /= totalRat;
    curN += ratio * (maxN - minN);
  }
 
  return pixelList;
}
 
void draw() {
  if (keyPressed) {
    drawNake();
  }
}
 
class Box {
 
  public static final int TYPE_EMPTY = 0;
  public static final int TYPE_VERTICAL = 1;
  public static final int TYPE_CROSSED = 2;
 
  public int type;
  public int maxDegree;
  public ArrayList topRow;
  public ArrayList bottomRow;
 
  public Box(int type, int maxDegree) {
    this.type = type;
    this.maxDegree = maxDegree;
    topRow = new ArrayList();
    bottomRow = new ArrayList();
 
    switch (type) {
      case TYPE_EMPTY:
        break;
      case TYPE_VERTICAL:
        fillRow(topRow, 2, 16);
        break;
      case TYPE_CROSSED:
        fillRow(topRow, 2, 16);
        fillRow(bottomRow, 2, 16);
        break;
      default:
        break;
    }
  }
 
  public void draw(int minX, int maxX, int ulY, int urY, int blY, int brY) {
 
    switch (type) {
      case TYPE_EMPTY:
        break;
      case TYPE_VERTICAL:
        // for each point along the line, draw a vertical line to the bottom
        for (int i = 0; i &lt; topRow.size(); i++) {
          float n = (Float)topRow.get(i);
          float x = lerp(minX, maxX, n);
          float topY = lerp(ulY, urY, n);
          float bottomY = lerp(blY, brY, n);
          line(x, topY, x, bottomY);
        }
        break;
      case TYPE_CROSSED:
        // for each point along the top row, draw a random number of lines
        // to points in the bottom row
        for (int i = 0; i &lt; topRow.size(); i++) {
          float topN = (Float)topRow.get(i);
          float topX = lerp(minX, maxX, topN);
          float topY = lerp(ulY, urY, topN);
 
          int outDegree = int(random(1, maxDegree));
          for (int j = 0; j &lt; outDegree; j++) {
            int randIndex = int(random(0, bottomRow.size()));
            float botN = (Float)bottomRow.get(randIndex);
            float botX = lerp(minX, maxX, botN);
            float botY = lerp(blY, brY, botN);
            line(topX, topY, botX, botY);
          }
        }
        break;
      default:
        break;
    }
 
  }
 
  public void fillRow(ArrayList inList, int minEls, int maxEls) {
    int numEls = (int)random(minEls, maxEls);
    inList.clear();
 
    for (int i = 0; i &lt; numEls; i++) {
      inList.add(random(0.0f, 1.0f));
    }
 
    return;
  }
}
 
class Circle {
  public int x;
  public int y;
  public int rad;
 
  public Circle(int x, int y, int rad) {
    this.x = x;
    this.y = y;
    this.rad = rad;
  }
 
  public boolean intersects(Circle other) {
    int xdiff = other.x - x;
    int ydiff = other.y - y;
    float distance = sqrt(xdiff * xdiff + ydiff * ydiff);
 
    return distance &lt; (other.rad + rad);
  }
}

Zack J-W 13 – 9 – 65

by zack @ 3:16 am

Zack's 13-9-65


This project was challenging for me in that I had not used ‘ArrayList’ , 2D arrays, or nested for-loops.  I spent the majority of my time understanding the logic and branching of the array data.  In the end I scaled back what began to look mostly like Nake’s 13-9-65 to better understand how the grid worked.

My interpretation of the Nake was that the seeming randomness around us has underpinnings of complex but elegant structure and that that can be synthesized particularly well by a machine built to process numbers.  While I ended with something I hope is evocative of nature I am personally intrigued by the synthesis.  This may lead to good things in the simulation project.


void setup()
{
  size(600,600);
  frameRate(1);
  stroke(1);
  noFill();
  smooth();
}
 
void draw()
{
  background(255);
 
  //Randomly generates new x (column) postions each time
  //thru the loop
  ArrayList xCoordinate = new ArrayList(); //Create a new x list
  int x = 0;  // The spacing of x (columns) begins from the left edge.
  xCoordinate.add(x);  //This fills the array with integers added to x
  while(x &lt; width)
  {
    int xSpacing = int(random(10, width/4));  //the space from one 'column' to the next
    x += xSpacing;  //a number from above is assigned to the value of 'x'...
    xCoordinate.add(x);  //that number is added to the next position in the array.
  }
 
  ArrayList yCoordinate = new ArrayList(); //Create a y list
  int y = 0;  //The spacing starts at the top.
  while(y &lt; height) //Until it hits the bottom,   {     int ySpacing = int(random(10, height/4)); //one of these numbers,     if (ySpacing &gt; height)  //as long as they don't add up to more than the height,
    {
      y = height;
    } 
    else
    {
      y += ySpacing;  //will be added to the next y points which place the rows.
      yCoordinate.add(y);
    }
 
    ArrayList field = new ArrayList(); //Create a new array of points
 
    for (int j=0; j1 &amp;&amp; i&gt;0)
        {
          PVector p1 = field.get(j*xCoordinate.size()+i-1);
          PVector p2 = field.get(j*xCoordinate.size()+i);
          //draw objects positioned relative to those points.
          line(p1.x,p1.y,p2.x,p2.y);
          line(p1.x,p1.y,p1.x + random(25,75),p1.y + random(-50,50));
        }
      }
    }  
    //Draw randomly sized and placed circles independent of the 2d array above.
    for (int i=0; i
« Previous PageNext Page »
This work is licensed under a Creative Commons Attribution-Noncommercial-Share Alike 3.0 Unported License.
(c) 2024 Interactive Art and Computational Design, Spring 2012 | powered by WordPress with Barecity