Varvara Toulkeridou – ButterflySorter
In how many different ways can you sort a collection? From how many different perspectives can you view an assembly of things?
A collection is a group of things related to each other in some identifiable way. The relationship might be through a topic, a place, a person, a type of object etc. Even though there is a specific motivation for gathering on the first place, what makes a collection dynamic is that one can reorganize the same data in alternative ways and make different sense of it.
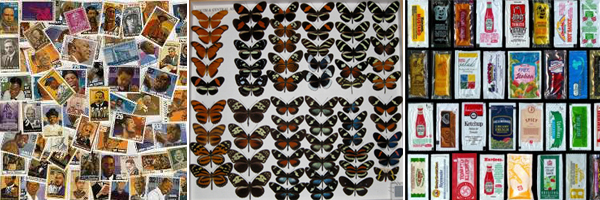
The motivation about this project came from the ‘Pink project’ by Portia Munson. The pink project comprised a series still life installations created out of the artist’s collection of discarded objects, all of which are varying shades of pink and are objects used by females. The discarded items assume new meaning when seen out of the perspective of the common color and the connotation with gender as well as through the way they are organized in space.


Portia Munson, Pink Project, 1994
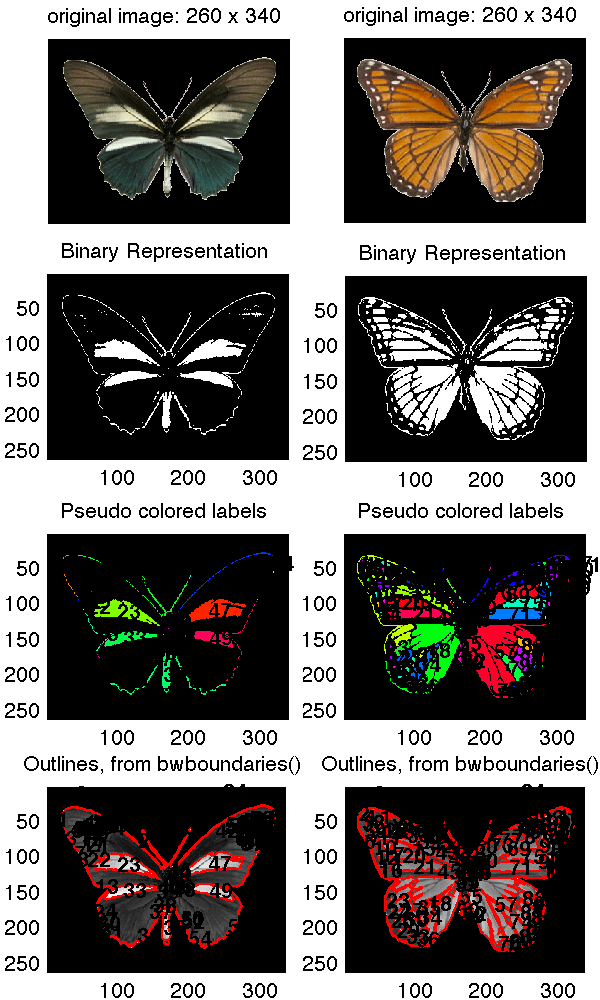
The data set I am using for the project, comes from a collection of images of butterflies provided by an iPhone app made by Hunter Research and Technology. The collection is composed by 240 images. Each butterfly is shown in plan on a white background; the images I extracted are 260×340 pixels in size. The only data accompanying the images is the name of each butterfly.

- perimeter of the butterfly outline
- area of the overall shape
- number of detected boundaries on the surface of the wings
- the image’s average value
- the image variance
- color histogram
From the results I got for the images I noticed that the values do not vary significantly. This, I believe, is also reflected on the slideshow: in most of the cases the reason for transitioning from one butterfly to the other is not observable. My impression is that given the collection under consideration (same family of things with similar characteristics) the linear ordering might not make that much sense in terms of results.
Also, it might have been wrong on the first place to compute the image statistics without taking into consideration that a significant amount of the image pixels were those of the background. So I run the histogram analysis taking a different approach:
(1) I considered all three color channels
(2) I masked the image in order to compute a histogram only on the butterfly shape
(3) I computed the similarity among all pairs of butterflies and got the corresponding sorts.
The results seem more reasonable. I think I should rerun all the previous tests under the new considerations! Also, I am looking forward to try using a spatiogram (a histogram that represents pixels that belong to edges) in order to sort the collection according to shape variation.
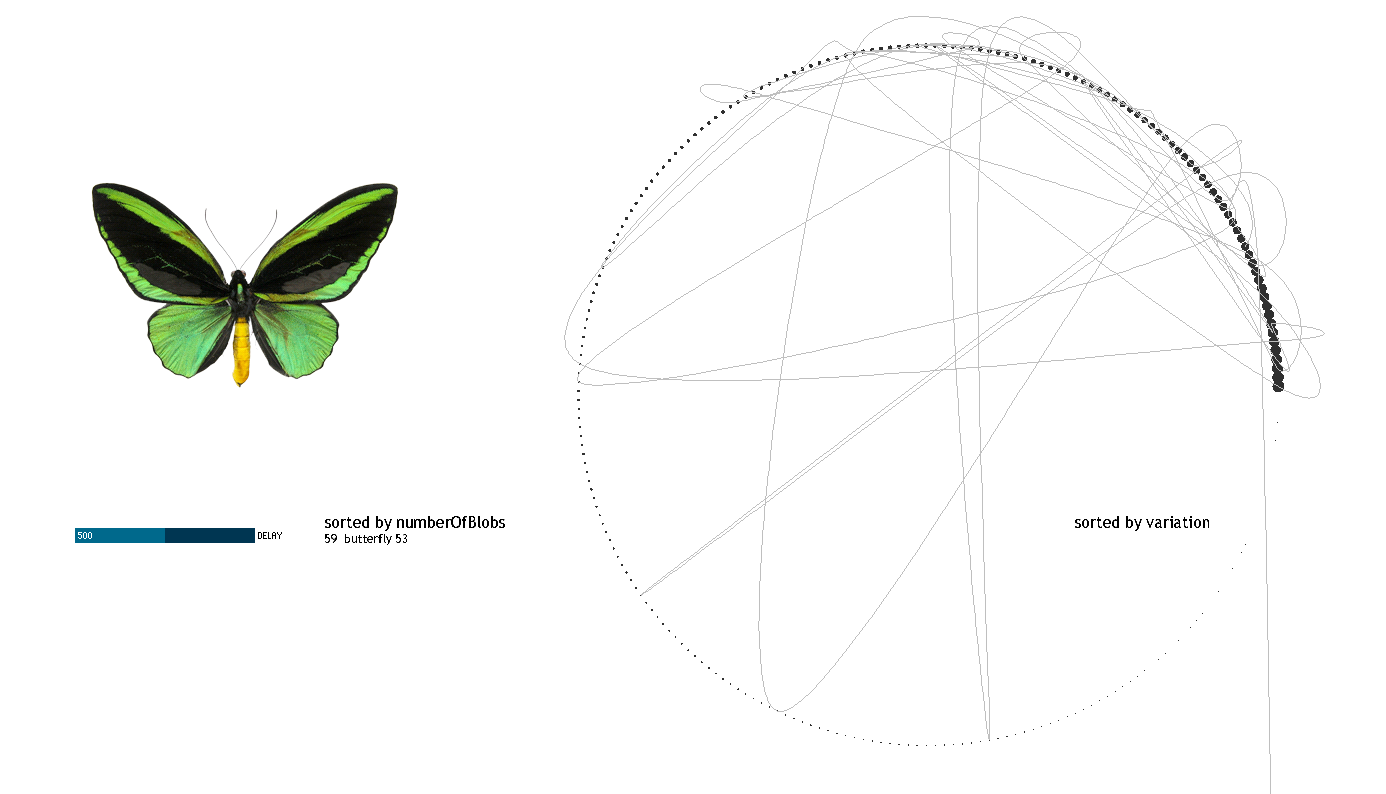
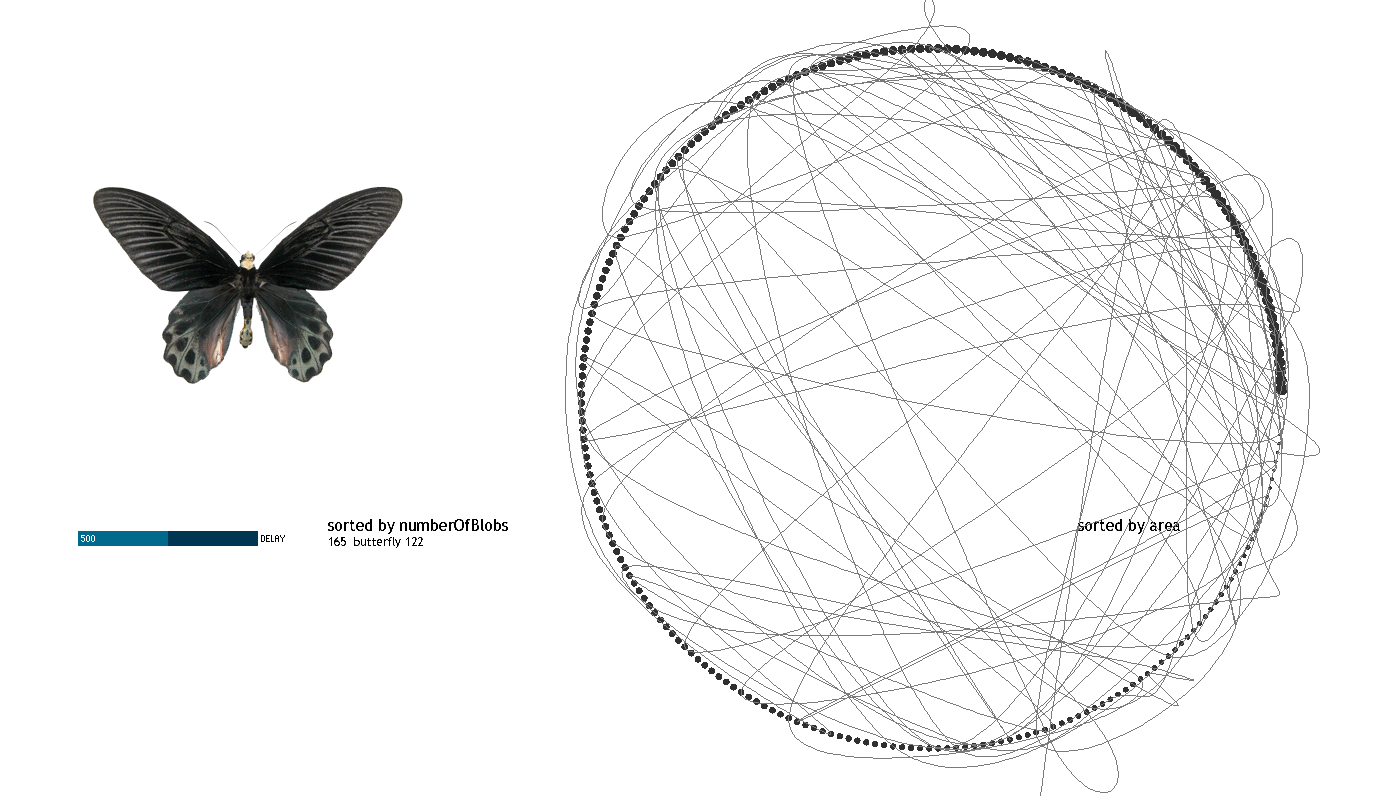
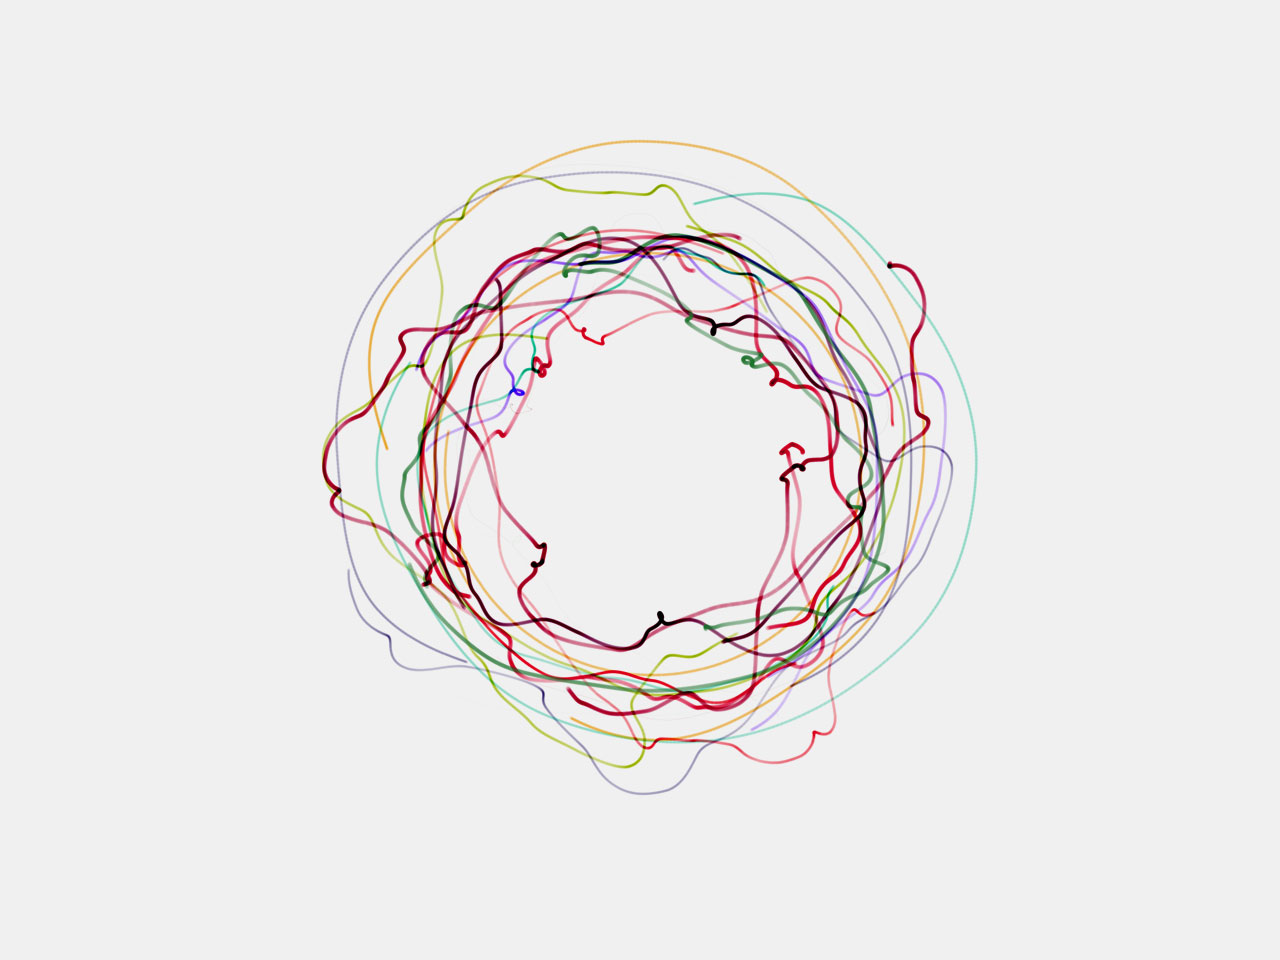
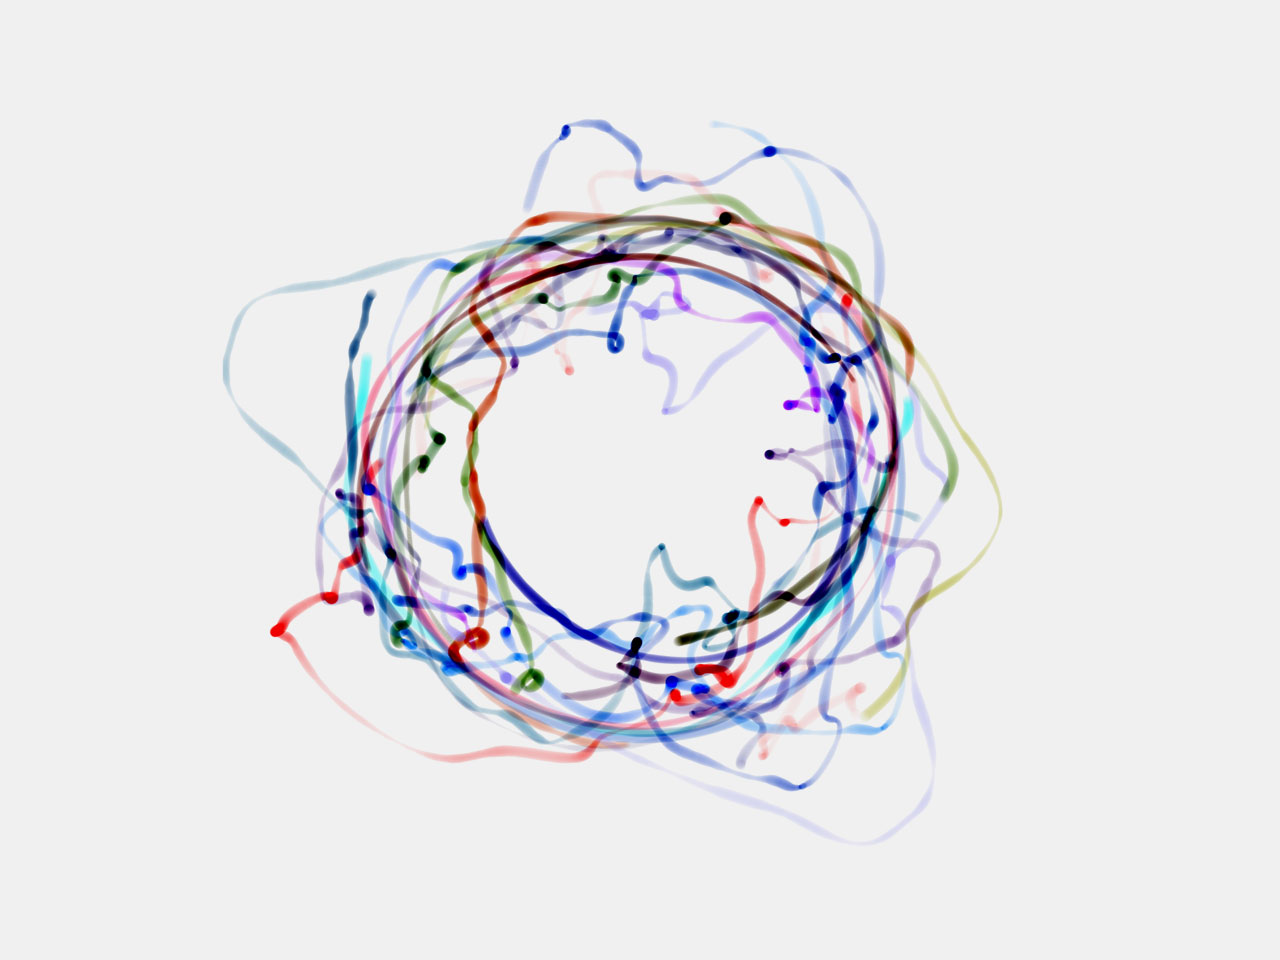
As a step further, I tried to see if there were any interrelations across the different linear sorts. The processing applet in the following video shows the butterflies positioned on a circle, represented by dots according to a given sort. The size of the dots is scaled according to the remapped value of each butterfly in the given sort. The user can select another sort and observe a line that connects the sequence of the current sort but on the sequence of the previous one. A curve line was selected to link the nodes because it was offering a better visual result for points on the circle that were close to each other.