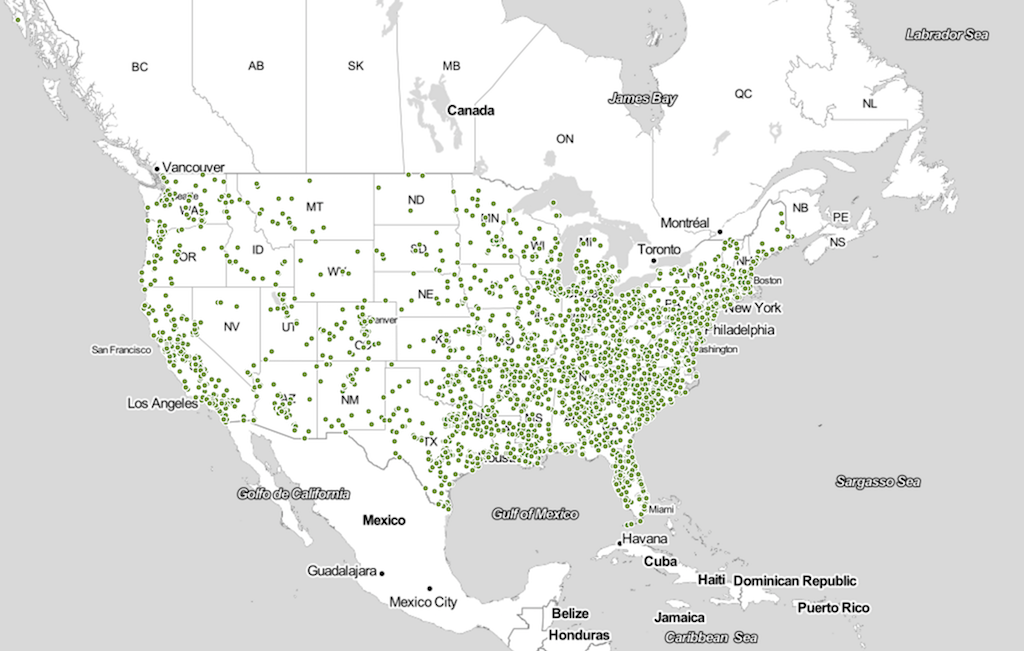
I picked the gun deaths in 2013 data set. I really liked the @censusAmericans twitter bot. I intended to tell a story about the individual deaths.
For the plotting on a map, I used Leaflets, along with the latlong data provided in the dataset.
I wanted to experiment with image manipulation and distortion in OpenFrameworks, for my non-map visualization. My intention is to to show a perfectly fine composition on a canvas distorted with time. As you move from January to December, I wanted to play different styles of showing unevenness of the canvas. It is still in progress.
Link to github – https://github.com/ajayans/IACD-Gauntlet1/tree/master/Gauntlet-Leaflet/root