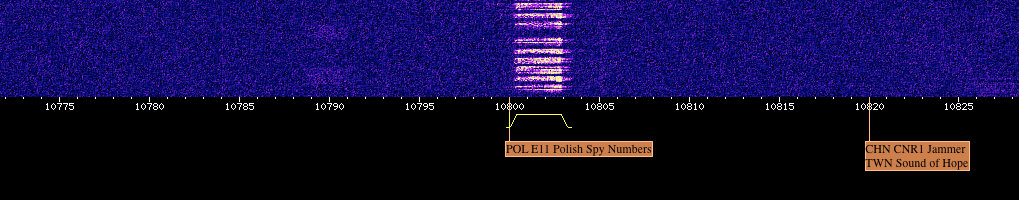
I’m interested in mapping number stations: encoded messages broadcast to spies over shortwave radio. There are two levels in which this relates to place: one is the mystery of where each station broadcasts from. For the most part, no country has readily admitted to its use of number stations, but communities of hobbyists have been able to roughly triangulate the source of some of them. Secondly, on a more ephemeral level, I find the idea of radio waves themselves to be an interesting place, filled with natural phenomena, but increasingly claimed and utilized by humans.
priyom.org is a great resources for hunting number stations, with an updated database of stations, broadcast schedule, and a link to a receiver that’s automatically tuned to the next scheduled broadcast. I would use these resources as a starting point to finding a way to visualize the airspace.
Another idea for a project involves a hard line that exists down the middle of the country that’s visible on maps of certain data. I first noticed it on a map of light pollution:
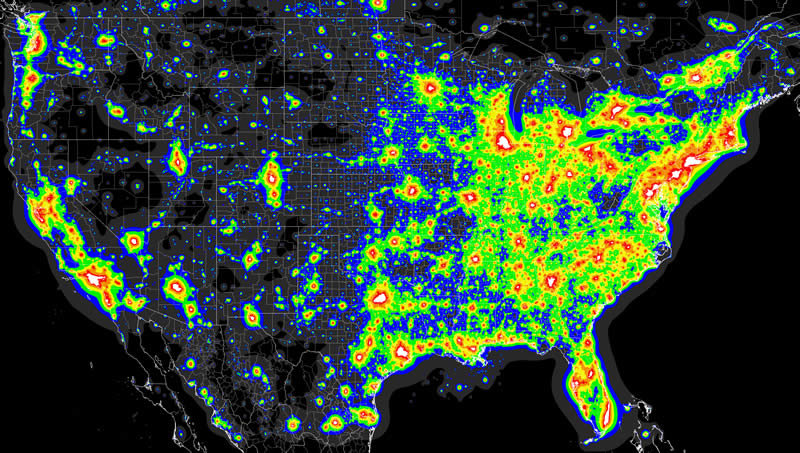
It doesn’t surprise me that the western US has more dark areas than the Eastern half. What surprised me is how hard the line between the two halves is. I’d be interested in researching the history of this division, possibly presenting light data against population density, expansions history data, or other information that would help tell a story.