7 Years of CMU School of Drama
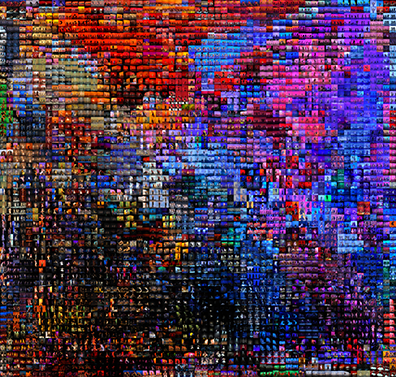
For my visualizations, I decided to create a set of small multiples comparing productions in CMU’s School of Drama. 17,000 images were scrapped from the School of Drama’s private flickr account, which after filtering for special events and rehearsal photos resulted in ~7,000 production photos. I then created 8 separate t-sne grids for the different types of productions in the school: Playground, Dancelight, New Works, Senior Thesis, Grad 2, Grad 3, Mainstage and a superset of all productions.
By using t-sne gridding it was possible to notice similarities between productions spread across many years which otherwise would not have been put in dialogue with each other. Additionally, in sharing the work with lighting designers it became apparent how certain aspects of the lighting infrastructure bleeds through into productions (e.g. the presence of highly saturated LED rigs in smaller spaces vs longer throw lights in larger spaces which are softer around the edges).
Permalink: http://kevinmkarol.com/tsne_grids.html
Play database ground work:
Working with the idea of large media datasets, I also scraped ~4,000 plays from CMU Library’s alexanderstreet.com database subscriptions. With permission to datamine the plays to create visualizations, I used python to extract the text of the plays into csv files that link character names with dialogue for analysis during my final project.