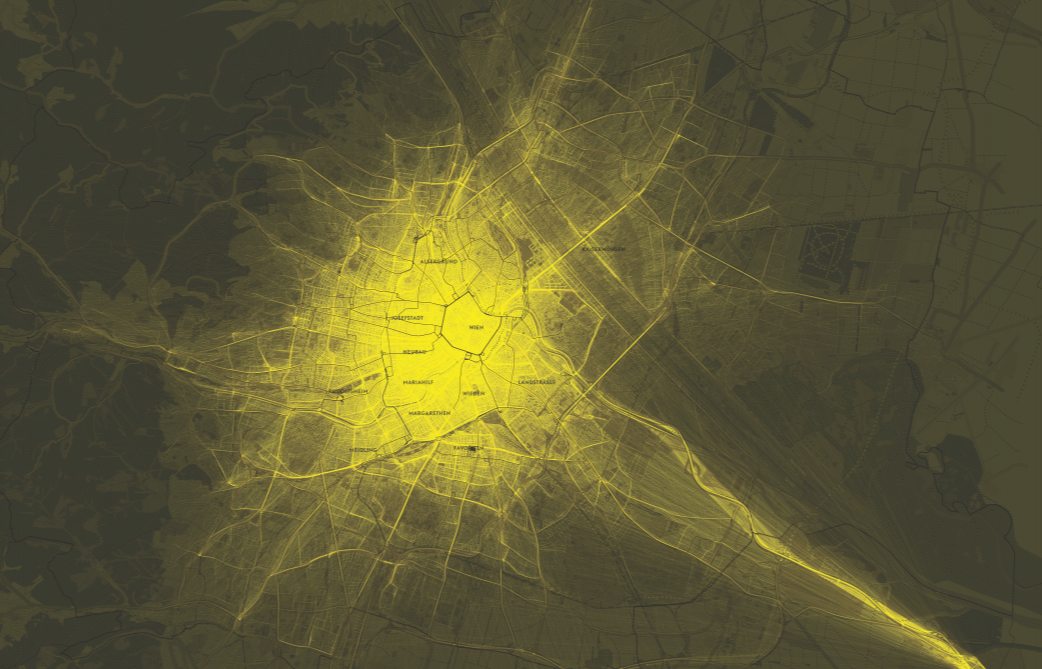
One day of taxis:
a beautiful visualization of the combination of everyday traffic and a day out of the life of a taxi driver. The map shows how the city infrastructure is use by as well the mass as individual people, showing the same (expected) patterns. Not only is the visualization a beautiful representation of traffic. The tracking of individual agents in an existing network is an excellent way to build a map.
(http://www.visualizing.org/full-screen/32596)

Curing:
However this visualization was meant to show the beauty of healthcare to me this representation shows the inequalities in the world concerning the health care access. This picture shows clearly that the western world (us and europe) has a significant higher amount of MR scans than the less developed countries. This is not only visualized at the worlds’ map, but also in the timeline: While you would expect an equal amount of scans during every moment of the day, the amount of scans increases extremely during the day time of the US and Europe and shows a major drop in amount during the Asian daytime.
(http://www.visualizing.org/visualizations/curing)

The brain unmasked:
Though the exact working of the brain is still not clear, we are getting to know about it every day. This visualization helps us to get a glimpse of the complexity of this organ and see the beauty of it. The brain, more complex than all computers ever made, is created by the beautiful system of evolution. This shows that by making small improvements to existing systems in combination with trial and error can lead to the most beautiful things. Not only in nature, but also in design.
(isualcomplexity.com/vc/project_details.cfm?id=646&index=47&domain=Biology)