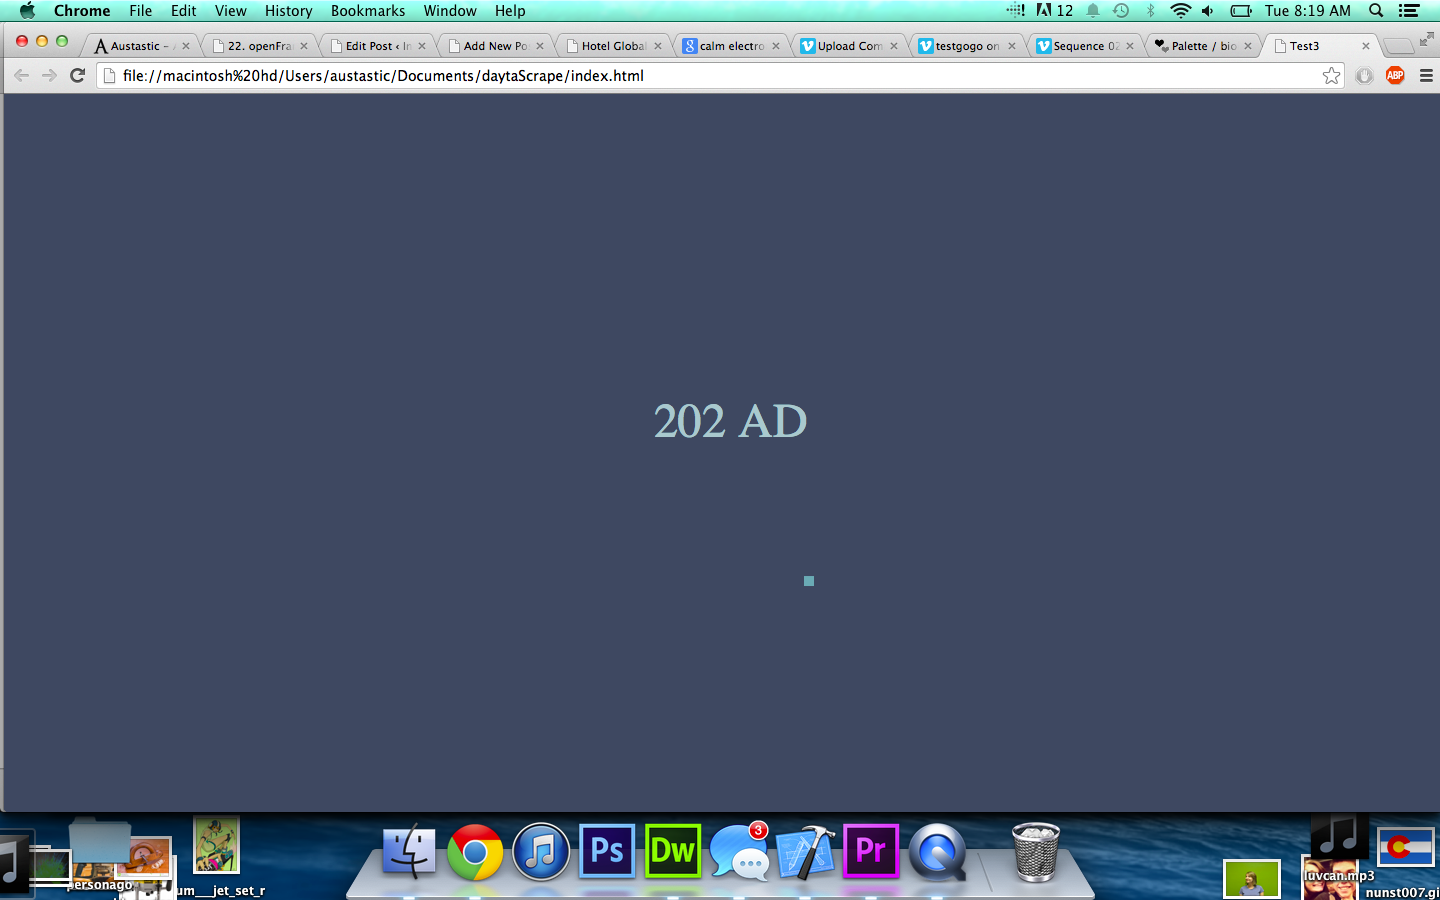
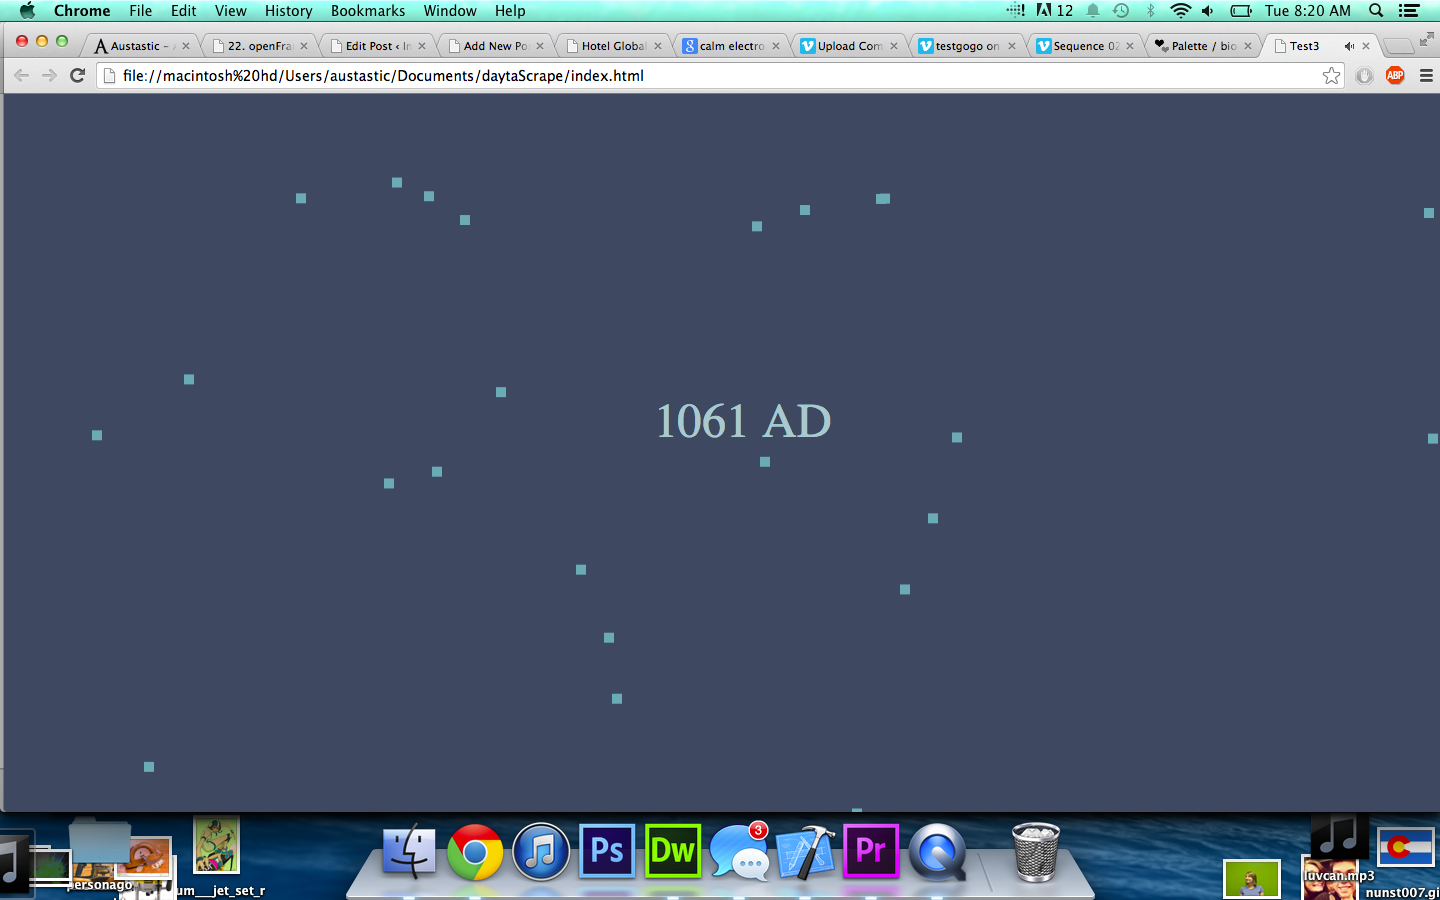
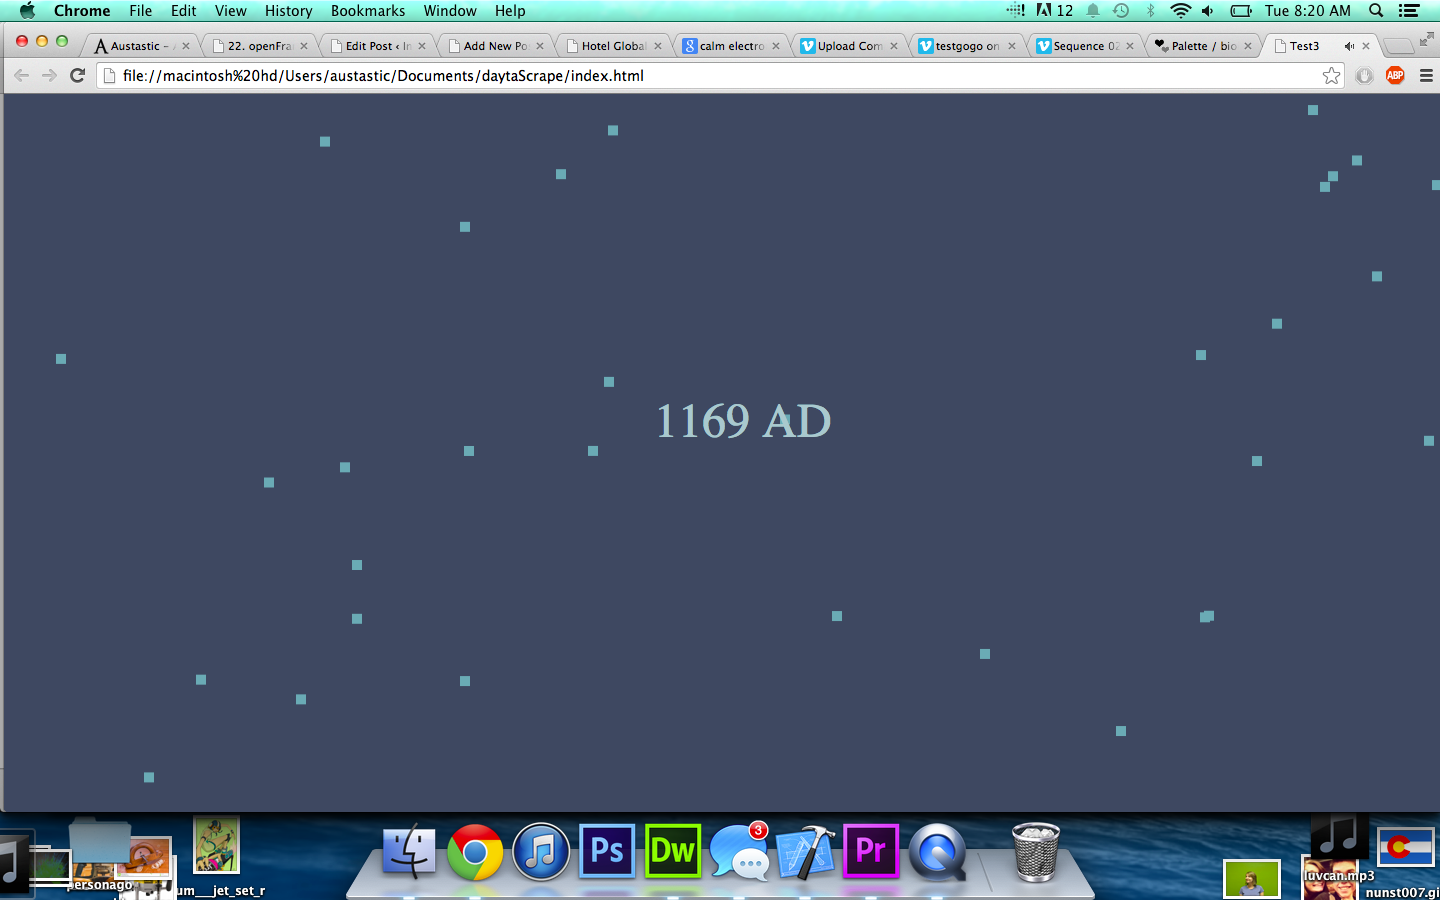
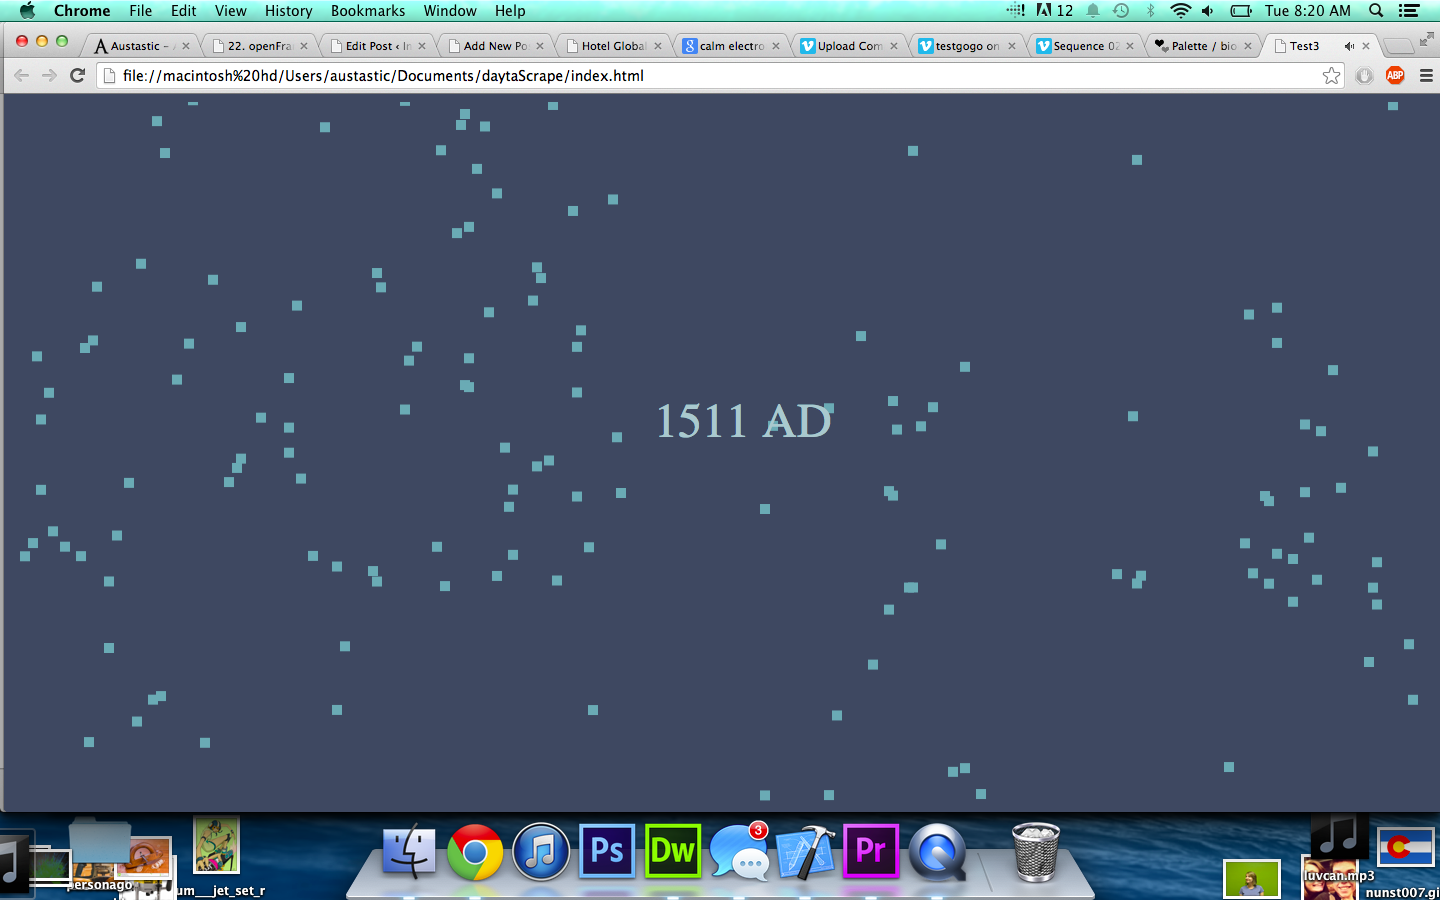
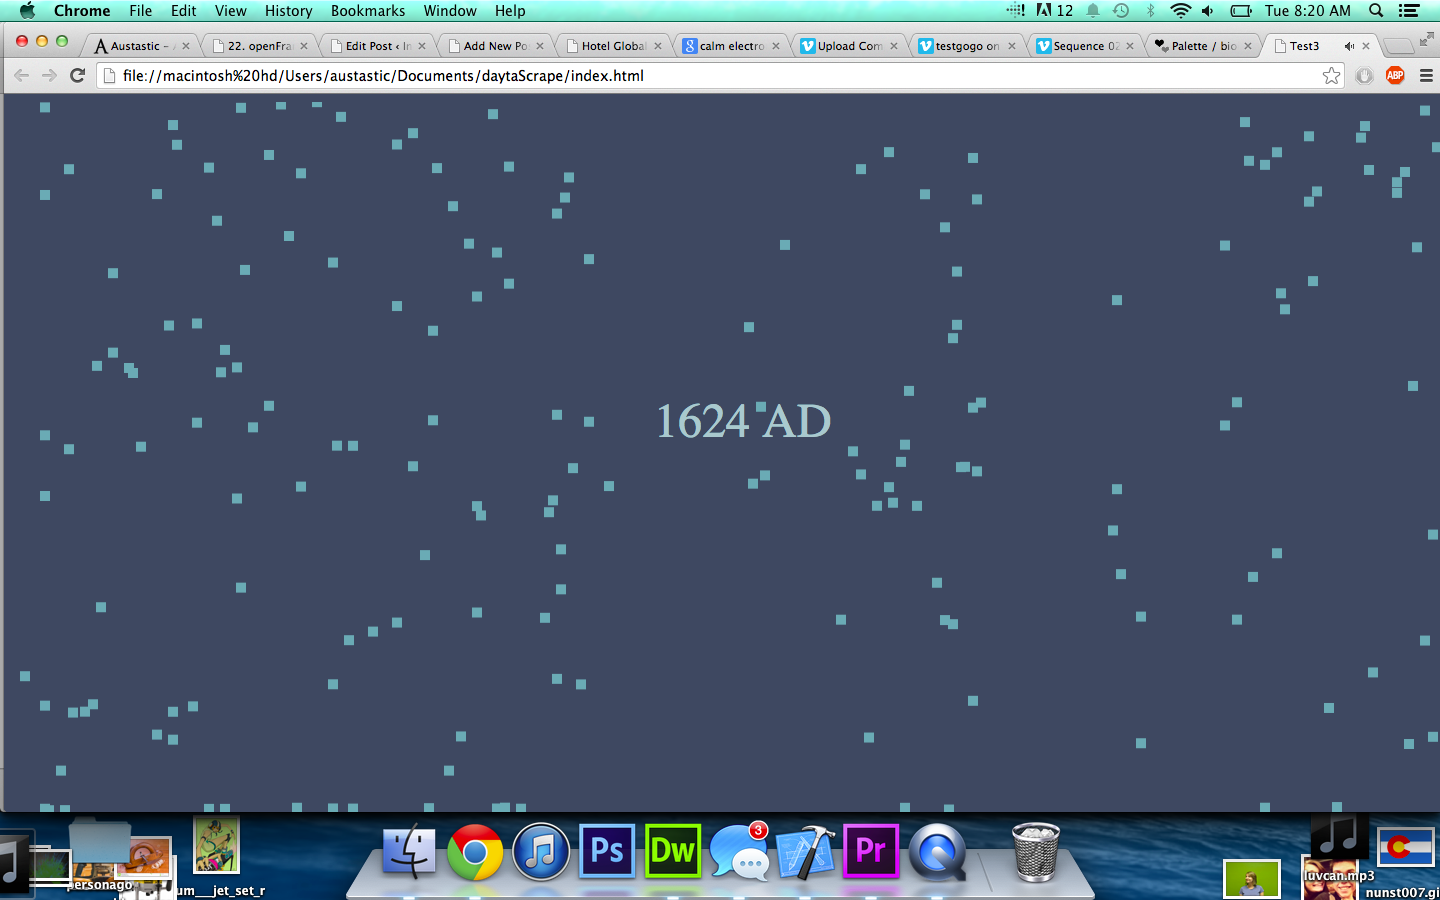
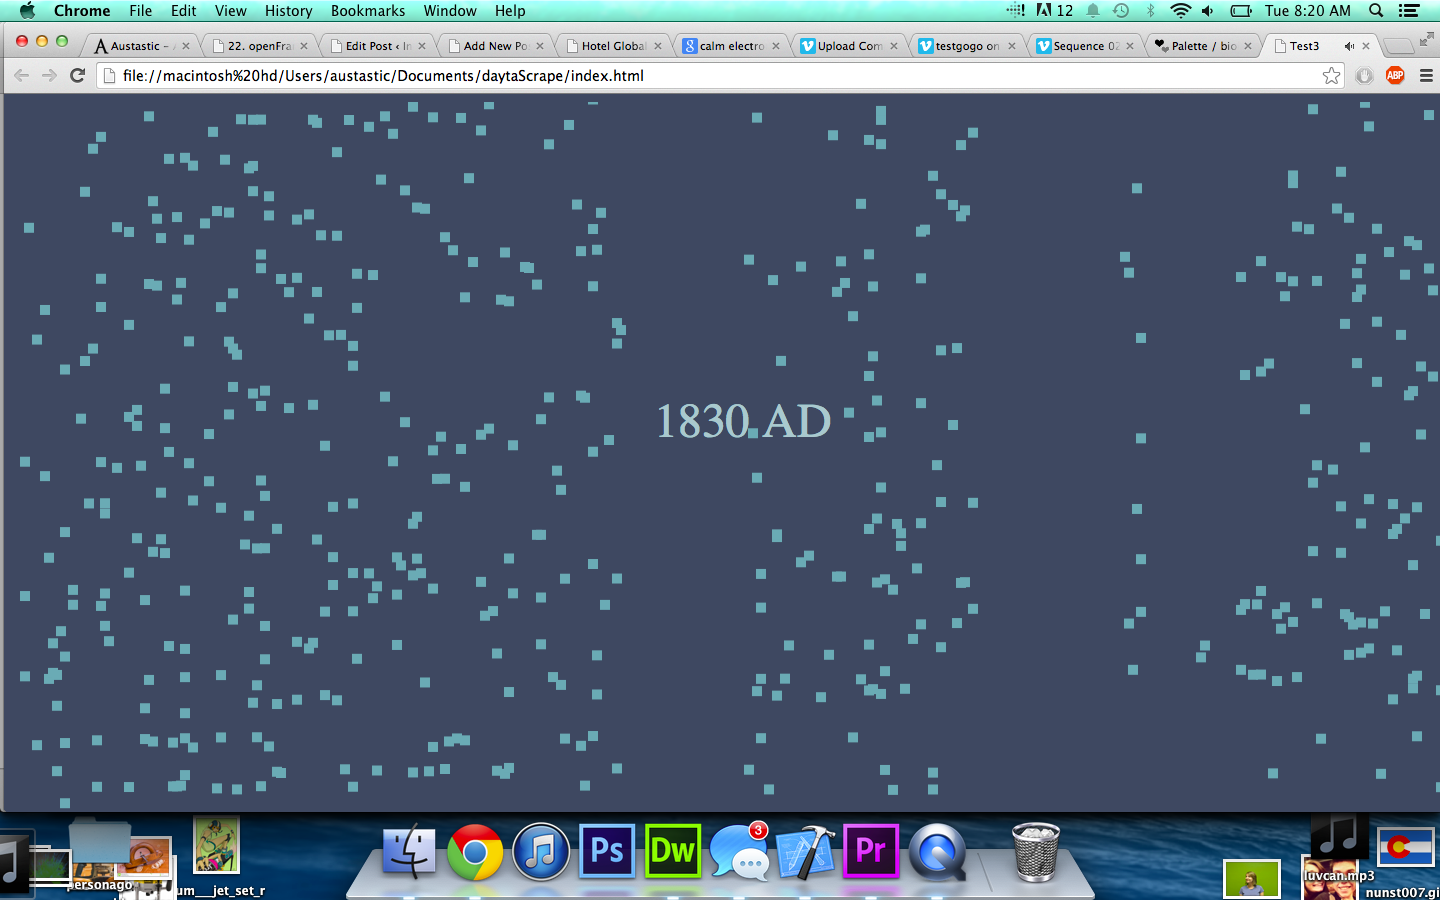
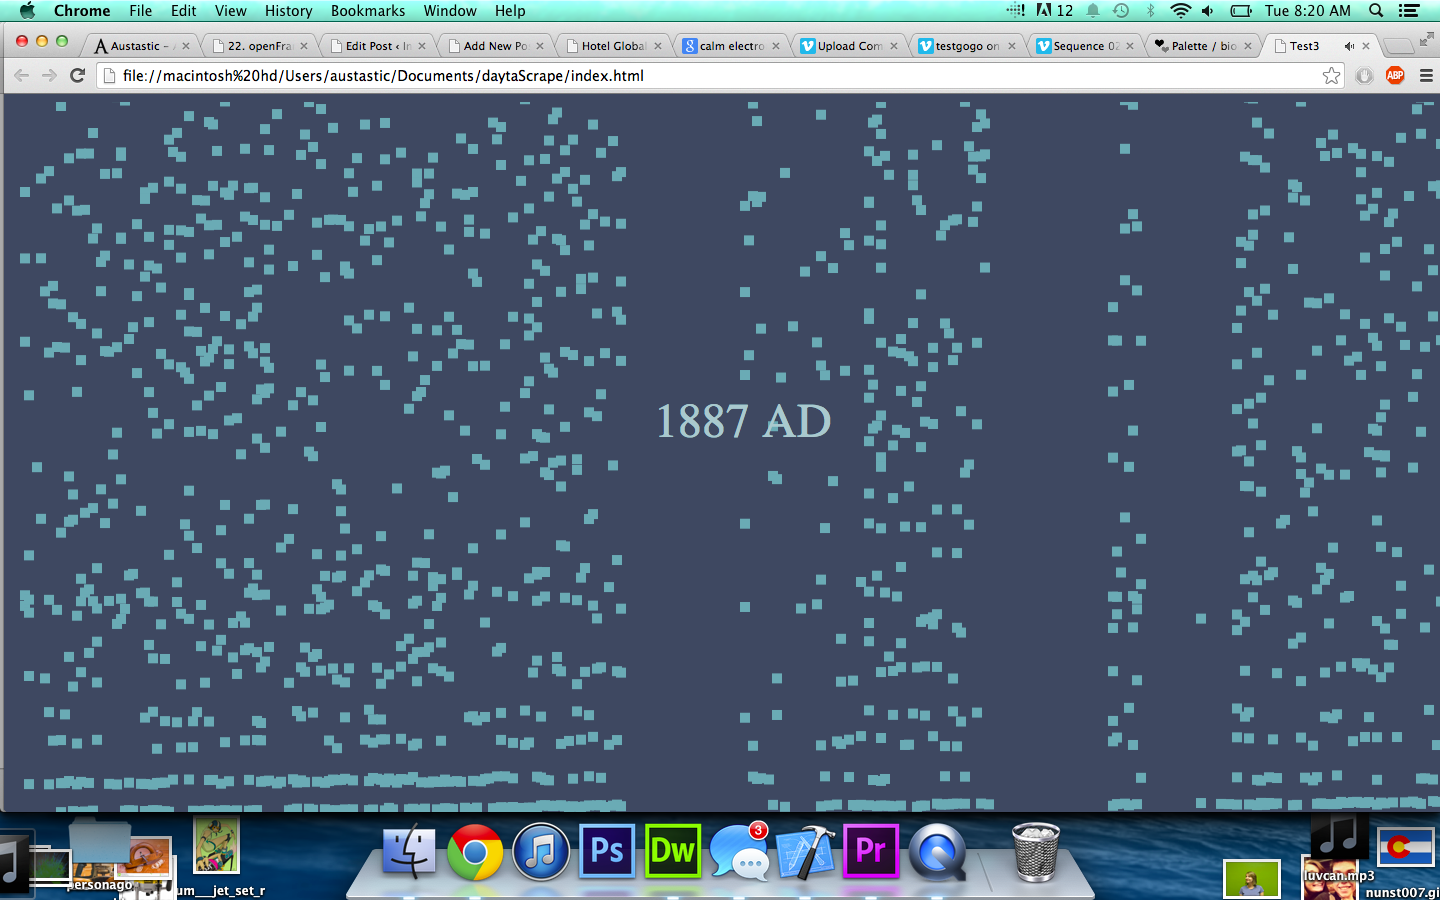
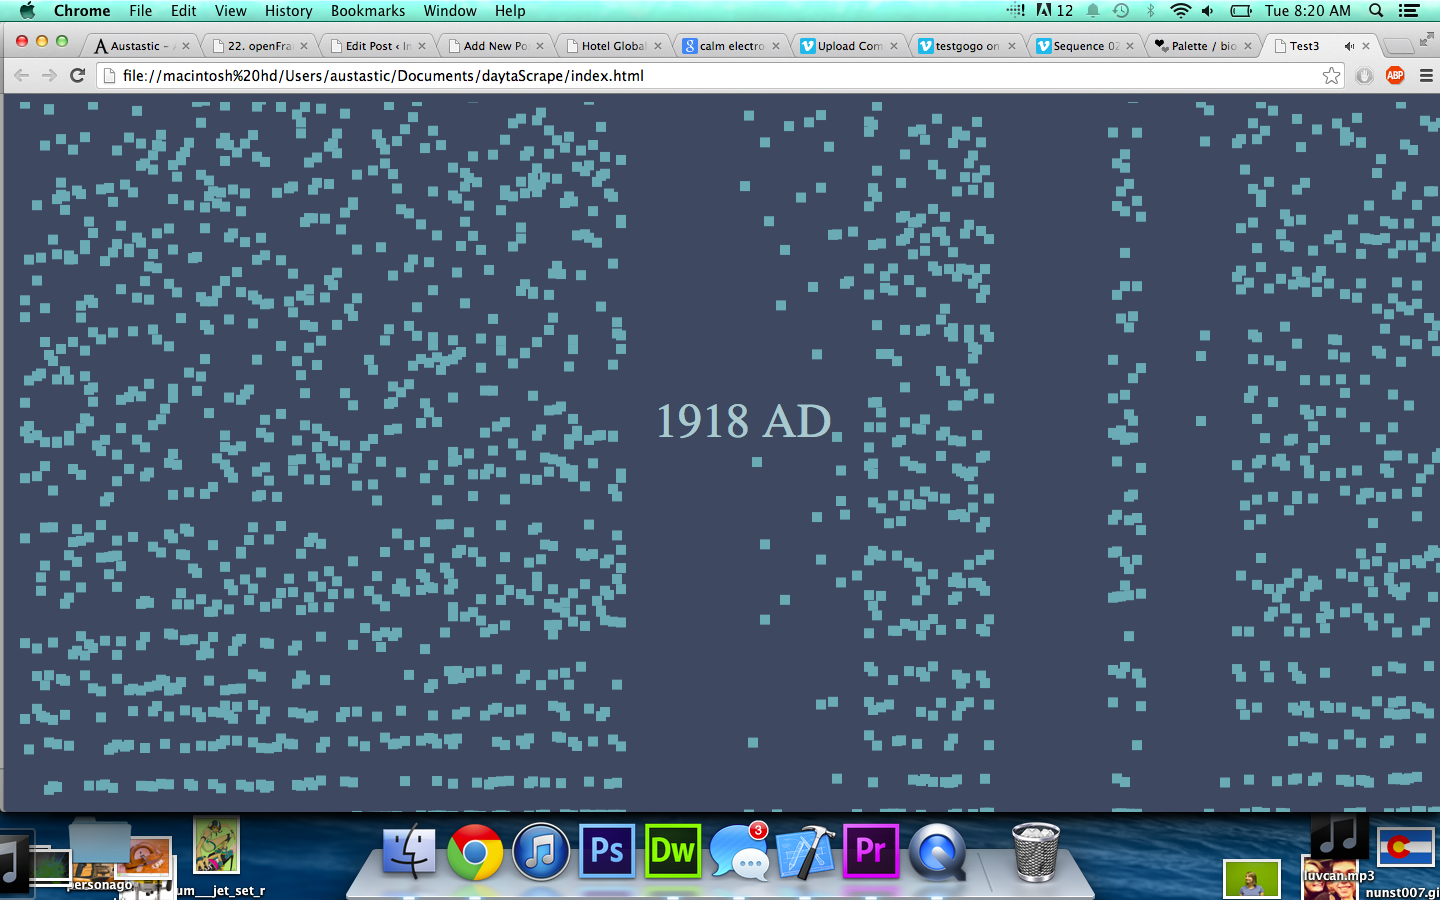
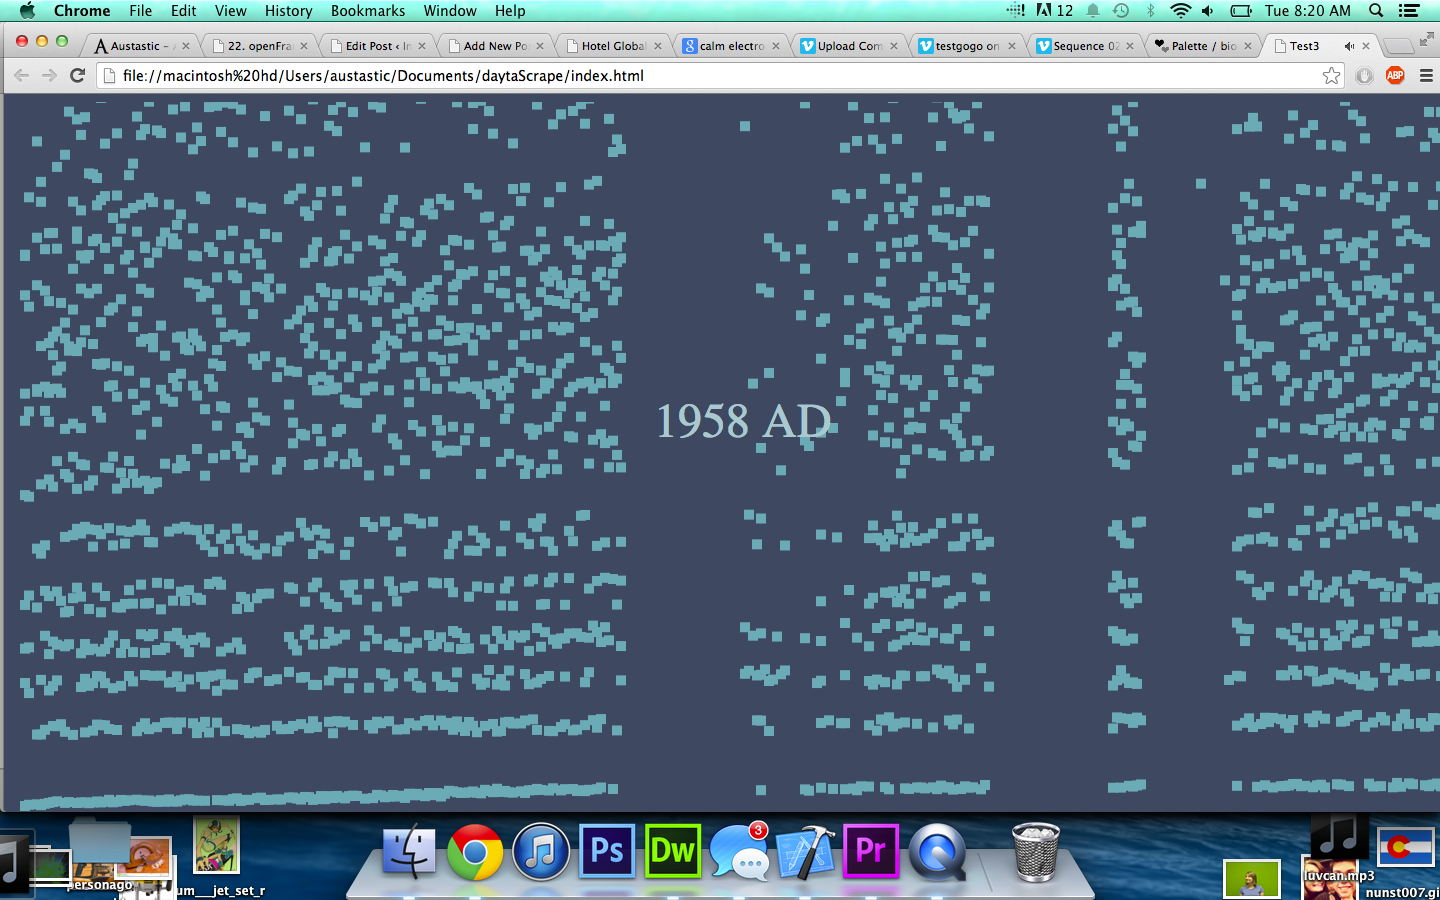
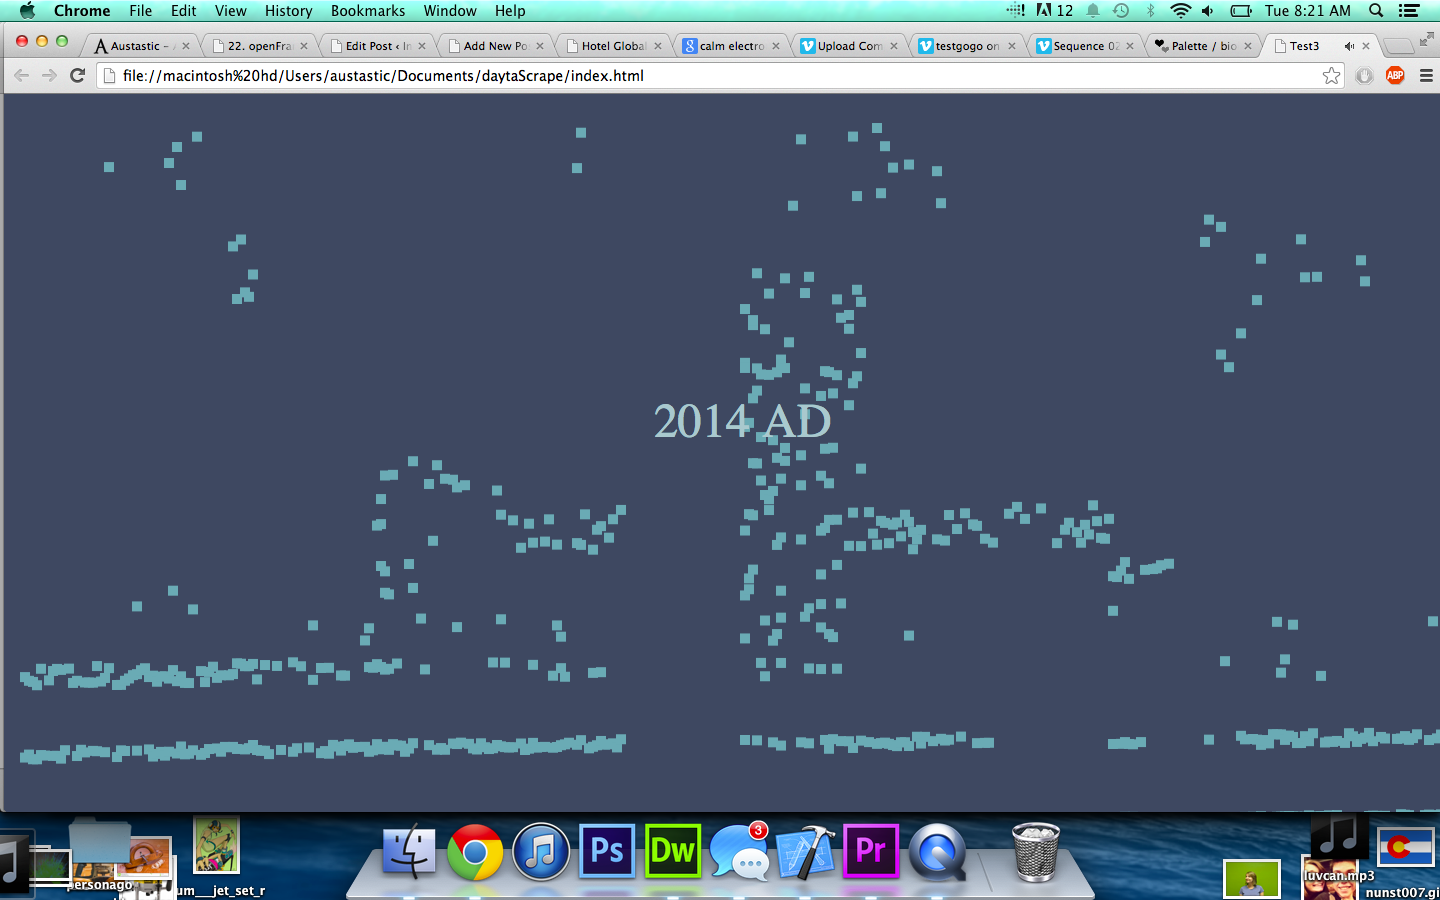
History storm is a data visualization of major historical events since the year 0. To get this data, I scraped . The visualization has 365 columns from left to right, each representing one day in a year. The droplets of history start out slowly, as we have less recorded history from earlier times. However, once we hit around the year 1000, there is a huge increase in the amount of data, which increases exponentially. The sound is a bit off, but each drop makes a noise when it hits – it is supposed to mimic a rainstorm; starting off slowly then increasing in frequency until it is a raging torrent of historical events.
Video: Here
GitHub: Coming Soon