Category Archives: 23-Scraping-and-Display

Sama Kanbour

11 Feb 2014

Github

Link

Description Using Kimono, I gathered songs that made it to the top 100 annual chart during the past 5 years. I extracted additional information – such as gender of the artist(s) and song lyrics – using multiple APIs, including last.fm and lyricsnmusic. I filtered and cleaned all this data, and pushed it to Google spreadsheets. I extracted the data using sheetsee.js and visualized it using four examples from D3.js. Some visualizations were easy to implement, such as the bubble chart, while others more challenging. This assignment was exciting, informative and an absolute delight. It made me realize how powerful Google Spreadsheets API is. I feel like there is almost no need for a back-end anymore, and this is simply wonderful.

ScreenShot001

ScreenShot002

ScreenShot004

ScreenShot003

Wanfang Diao

11 Feb 2014

382643EF-1725-46C9-B60C-BC87F5345DBC


This is a data visualization for 2008 Olympic Game gold medals. I scraped data form wikipedia. I am a beginner of JavaScript. I fork a example of d3, and add labels of country name on each bubble. I will continue study about JavaScript to figure out how to make it more interactive and add more years of Olympics.

Kevyn McPhail

11 Feb 2014

Here is my D3 visualization of the activity of Curbed:NY. A little background on curbed, the website shows the different architectural and real estate development and sales in a region. So what I did was use create a custom scraper that gets the amount of times that neighborhood is mentioned. Finally, I graphed that data to see how different neighborhoods compare to one another. One interesting find is that I did not expect Harlem to have a lot of activity. I did some more reading to see that the district is beginning to undergo a period of gentrification.

I hate javascript, its an annoyingly funky language that’s not very explicit on what you need and when you need it. I had a lot of issues with types of variables being passed/not passed through some functions (callbacks) and had to jerry-rig the code quite a bit…but I got the hang of it around 2am the night before this was due and above is the result of my dance with javascript!

git

JoelSimon 2-3 Scrapping

For this I scrapped 70GB of wikipedia page views for all of  June 2013. This data is all available on public amazon s3 buckets with the views for every page per hour. I use amazon map reduce to reduce this to only pages with over 100k views and for every day what the views were.

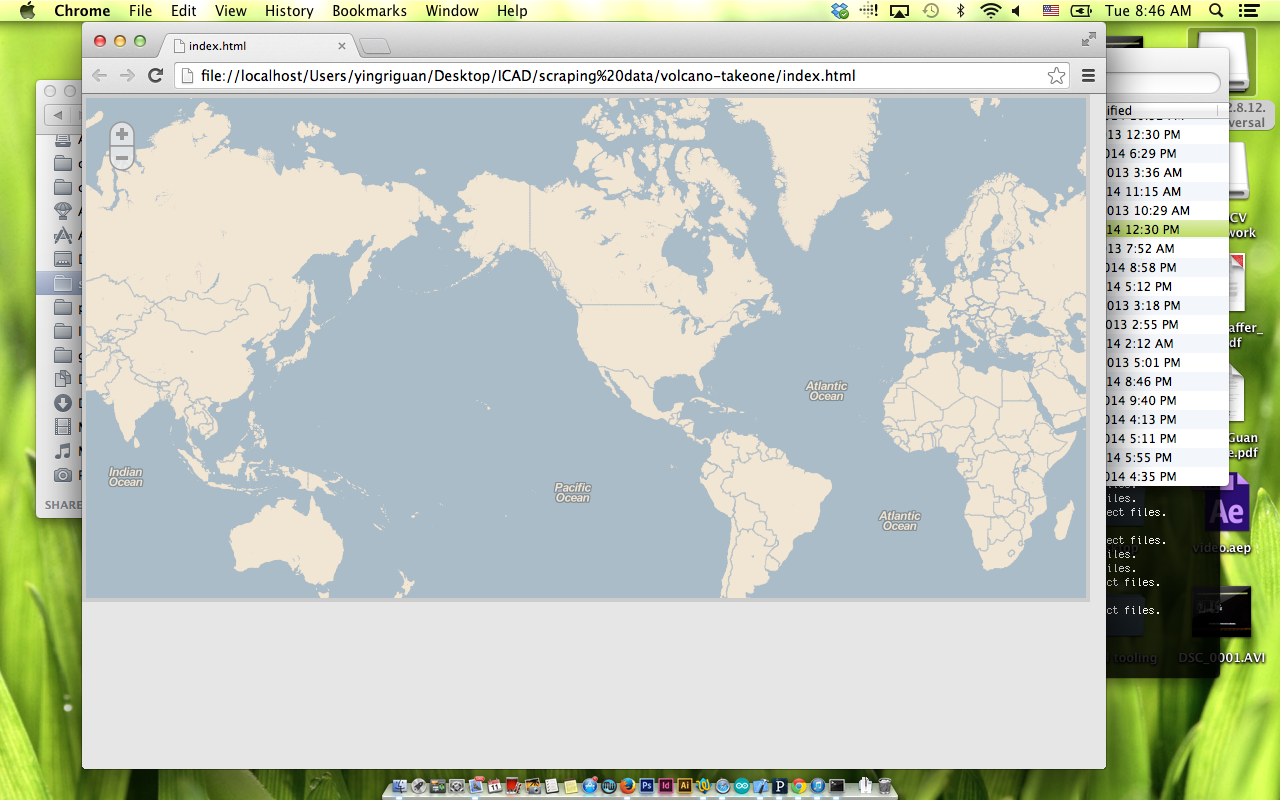
Here all pages over 500k views can be seen and clicking on any one shows a graph of the view over the month.

Some interesting trends were:
Yahoo jumped from about nothing to 450k/day when they announced the purchase of tumblr.
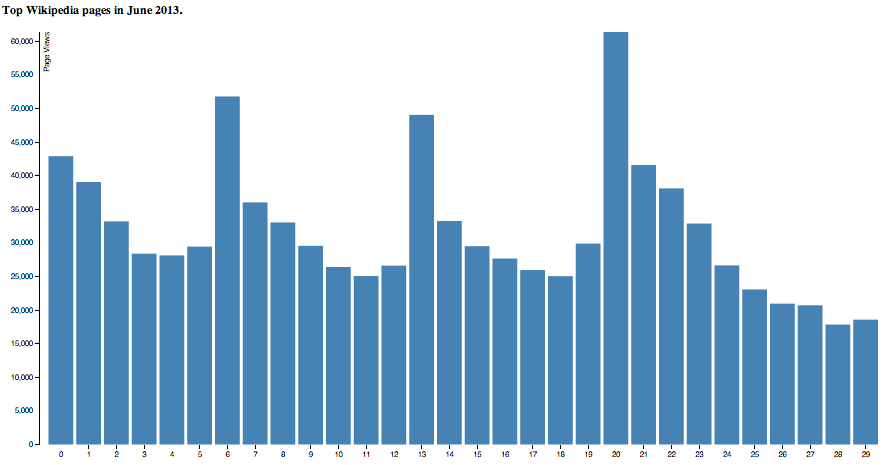
Tv shows peaked every 7 days.
People search for cat anatomt…

Screenshot 2014-02-11 09.13.58

Yahoo when they bought tumblr..
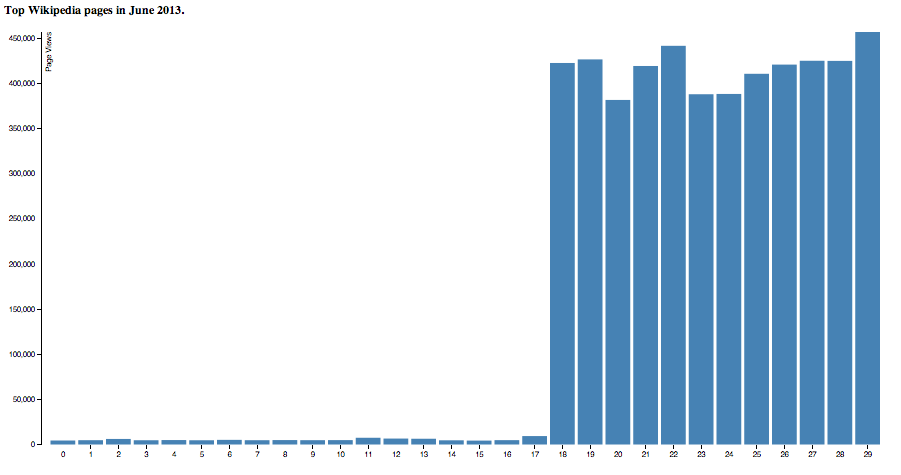
Screenshot 2014-02-11 10.38.50

Hannibal TV show

Screenshot 2014-02-11 10.42.32

What a mapReduce program looks like..

#!/usr/bin/python
from __future__ import print_function
import fileinput
import sys
import os
badTitles =  ["Media","Special","Talk","User","User_talk","Project","Project_talk","File","File_talk","MediaWiki","MediaWiki_talk","Template","Template_talk","Help","Help_talk","Category","Category_talk","Portal","Wikipedia","Wikipedia_talk"]

badExtns = ["jpg", "gif", "png", "JPG", "GIF", "PNG", "txt", "ico"]
badNames = ["404_error/","Main_Page","Hypertext_Transfer_Protocol","Favicon.ico","Search"]
#arr = []
#count = 0
#fullName = 'pagecounts-20130601-000000'#os.environ["map_input_file"]
fullName = os.environ["map_input_file"]
fname = fullName.split('/')
date = fname[-1].split('-')[1]

def process(line):
#	global count
        L = line.split(" ")
#	count += int(L[2])
	if not line.startswith("en "):
		return
	L = [L[1], int(L[2])]
	#count += L[1]
	#if(L['name'] != "en"):
	#	return
	for i in xrange(len(badTitles)):
		if(L[0].startswith(badTitles[i])):
			return
	if ord(L[0][0])>96 and ord(L[0][0])<123:
		return

	for j in xrange(len(badExtns)):
                if(L[0].endswith(badExtns[j])):
                        return

 	for k in xrange(len(badNames)):
                if L[0] == badNames[k]:
                        return

	#dateArr = [0]*30
	#dateArr[int(date[-2:])]= L[1]
	print (L[0]+"\t"+date[-2:]+"\t"+str(L[1]))
	return
	#print L['title']+"\t"+L['numAccess']

#total = 0
for line in sys.stdin:
	line = line.strip()
	process(line)	
#	total += 1

#f = open ("/home/ubuntu/output.txt", 'w')
#arr = sorted(arr, key = lambda x : x[1])
#print ("sorted", total, count, len(arr)) 
#for z in xrange(len(arr)) :
#	string = arr[z][0]+"\t"+str(arr[z][1])+"\n"
#	f.write(string)
	#print(string, file = "/home/ubuntu/output.txt")
#f.close()
#print ("Written to file.")
#!/usr/bin/python

import sys

last_key = None
running_total = 0
viewsPerDay = [0] * 30
threshold = 100000
for input_line in sys.stdin:
	input_line = input_line.strip()
	input_line = input_line.split('\t')
	#print input_line
	if len(input_line) != 3:
		break
	articleName = input_line[0]
	date = int(input_line[1]) # 1 - 30 inclusive
	viewsThatDay = int(input_line[2])

	if last_key == articleName:
		running_total += viewsThatDay
		viewsPerDay[date-1] += viewsThatDay
	else:
		if last_key and running_total > threshold:
			print(str(running_total)+'\t'+last_key+'\t'+str(viewsPerDay))
		running_total = viewsThatDay
		last_key = articleName
		viewsPerDay = [0] * 30
		viewsPerDay[date-1] += viewsThatDay
if last_key == articleName:
	print(str(running_total)+'\t'+articleName+'\t'+str(viewsPerDay))

Haris Usmani

11 Feb 2014

draft_chart

Question I investigated: How many of my female friends’ name ends with the letter ‘a’?

I remember sometime in my undergrad, while working on an assignment late night with a couple of friends, we asked each other the question: What’s the easiest/quickest query to filter female names from a list of mixed first names? I blurted out, just see the names that end in ‘a’- this was an observation I made some while back. Everybody thought about it for while (hmmm?) and nodded- So for this assignment, I wanted to test it quantitatively.

I used the Facebook API through an online console called APIGEE to get my friend list details. I was primarily interested in first names and gender. The APIGEE gave me a JSON file with all my friends’ data in it- I converted it to CSV and used Excel to apply the queries and group the data by a simple pivot table. I saved this data to a Google Doc Sheet.

Workflow:
Facebook API -> APIGEE (https://apigee.com) -> JSON to CVS (by http://jsfiddle.net/sturtevant/vUnF9/) -> Excel (Apply Queries, Consolidate Data by Pivot Tables) -> Sheetsee

A problem I faced was that Sheetsee’s chart example was so longer available. I had got everything loaded till the Google Doc. Just needed to troubleshoot and get the Sheetsee Code running.

Google Docs Data Sheet

Meanwhile, I used D3 to make the following Pie-Chart choosing from the large list of D3 examples available at http://christopheviau.com/d3list/


GitHub

Yingri Guan

11 Feb 2014

Volcanoes

For this project, I am working with the volcanoes around the world. The dataset scraped using Kimono is available here. However, I don’t have my D3 program working and just have a work in progress to show.

Screen Shot 2014-02-11 at 8.46.06 AM

Screen Shot 2014-02-11 at 8.38.25 AM

Austin McCasland

11 Feb 2014

History storm is a data visualization of major historical events since the year 0. To get this data, I scraped . The visualization has 365 columns from left to right, each representing one day in a year. The droplets of history start out slowly, as we have less recorded history from earlier times. However, once we hit around the year 1000, there is a huge increase in the amount of data, which increases exponentially. The sound is a bit off, but each drop makes a noise when it hits – it is supposed to mimic a rainstorm; starting off slowly then increasing in frequency until it is a raging torrent of historical events.

Live Version

Video: Here

GitHub: Coming Soon

Screen Shot 2014-02-11 at 8.19.54 AM

Screen Shot 2014-02-11 at 8.19.57 AM

Screen Shot 2014-02-11 at 8.20.24 AM

Screen Shot 2014-02-11 at 8.20.28 AM

Screen Shot 2014-02-11 at 8.20.39 AM

Screen Shot 2014-02-11 at 8.20.43 AM

Screen Shot 2014-02-11 at 8.20.51 AM

Screen Shot 2014-02-11 at 8.20.53 AM

Screen Shot 2014-02-11 at 8.20.55 AM

Screen Shot 2014-02-11 at 8.20.57 AM

Screen Shot 2014-02-11 at 8.21.01 AM

Where the movies last year were filmed

I scraped IMDB for all the feature films from 2013 (a surprising 8,654 of them). Then I scraped IMDB again for each of those films to get all the locations where they were filmed. Then I had to use 4 different computers to send each one of those filming locations to the Google Maps API to get the latitude and longitude for the locations in order to get around the 2,500 daily call limit.

I used the D3 Map Starter Kit as the foundation for my visualization, and read in the DSV file created from the python scraping scripts. A point was placed at each Cartesian coordinate indicating a filming location for one of the 8,000 or so films. By hovering over the point you get the location name and the film name on the right hand side of the screen. By clicking the point a window appears and loads the film’s IMDB page.

moviesI would have liked to sort the points by location, so that the location only appears once and all the film were listed under that one point. As it sits now each point is one location on one film, which means some points are undoubtedly inaccessible. I would of also liked to add a bit more visual appeal, including more details about each film, like the poster image, rating, and genres. But I never got around to writing a fourth script to get those details.

d3

Check it out: http://jeffcrossman.com/filmlocations/

Source files: https://github.com/jeffcrossman/ImdbScraper

Shan Huang

11 Feb 2014

Demo available here

Wikipainting is like a wikipedia of paintings. It is a really lovely online resource because it provides tons of high resolution images – and everyone loves high res images! I really enjoy browsing the site in my spare time and running into unexpected works for artists I’ve never heard of. I also secretly really want to scrape all the beautiful paintings on the site and save them somewhere on my disk. So for my data scraping project, I scraped all self-portraits found on wikipaintings.org and visualized them based on a timeline:

screen1

Technology wise I used the beautiful soup library which turned out to be really handy for interpreting HTML pages – as many have recommended. I did not run into much trouble to make the scraper work. I scraped all the image urls found in Wikipainting‘s self-portrait genre, along with some other information like artist names, styles of the paintings and urls to the work detail page. But I overlooked a detail – the page displays a scroll bar for artists with more than five self portraits but I god damn forgot to parse it. As a result I missed a good amount of the data and only got 400+ entries in the end. I plan to fix it and rescrape the site in the near future.

Anyways, the process went pretty smoothly overall. I made a grid layout in HTML/JS and fed data to it using the D3 library. I haven’t used D3 before but picking it up wasn’t that challenging. After some tutorial reading, fiddling around with D3 sample code and debugging, I have my visualizer working: http://shan-huang.com/600SelfPortraits/index.html. (Layout design shamelessly stolen from REI1440 project website. )

I think the result is pretty interesting. It’s super fun to dive in and see how (crazy/talented) human being’s self perception evolves over time. Here are screen shots of some amazing self-portraits I discovered through my visualizer:

7^ Self-portrait by Alexander Shilov. Though finished in 1997 it weirdly has the Renaissance look and feel as if it were a portrait of someone from the 16th century…

6 ^ I really, really like this piece for many reasons, color being the most apparent one.

5

^ Another nice black and white piece.

4

^ Another gorgeous piece from the old masters.

Github: https://github.com/yemount/proj2-portraitscraper


Ticha Sethapakdi

11 Feb 2014

I wasn’t sure what data to use for the scraping assignment, so I decided to geek out instead.

Pokemanz

(data scraped from Bulbapedia using kimonify)

As a huge fan of the Pokemon games, I probably find statistics like these to be more useful than most other people… It is also interesting to see how Pokemon types correlate (somewhat) to the distribution of animals in the real world (e.g. Water Pokemon are the most common).

I want to also compile statistics of animals found in different geographic landscapes (volcanic areas, rainforests, deserts, etc.) and associate them with some of these Pokemon statistics somehow. Finding connections and discrepancies between the real world and virtual world is both really interesting to investigate and easy to visualize using statistical data.

After the project, I made an attempt to change the data and modify the visualization so that it could be both more interesting and interactive. My idea was to compare Pokemon types against Pokemon Egg Groups and see how types were distributed between different Egg Groups. To achieve this, I would use a Clustered Force Layout, in which the Pokemon would be ‘clustered’ by Egg Groups with the colors denoting the type. Unfortunately, I had trouble compiling the html file and ran into errors like “XMLHttpRequest cannot load file” that I was not sure how to work around… Joel suggested that I use Python’s HTTPServer, so I was able to work around that issue. Thanks!

Regardless of all the difficulties I’m having, I am still really interested in revisiting this project later (after consulting people who are more proficient at D3 than I am)–mostly out of personal curiosity for how the data would look like.

Github here.