D3.js (or just D3 for Data-Driven Documents) is a JavaScript library that uses data to drive the creation and control of dynamic and interactive graphical forms in the browser. It is a tool for data visualization in W3C-compliant computing, making use of the widely implemented Scalable Vector Graphics (SVG), JavaScript, HTML5, and Cascading Style Sheets (CSS3) standards.
This page covers three topics:
- General Resources for D3
- Using D3 in WordPress
- Piping Google Spreadsheets to D3 with Sheetsee
General Resources for D3
The central D3 API documentation repository is here:
https://github.com/mbostock/d3/wiki/API-Reference
A wide range of excellent D3 examples can be found here. There is an example for nearly every sort of conventional information visualization pattern:
- The official D3 Wiki Gallery
- Mike Bostock’s Bl.ocks.org D3 example compilation
- Mike Bostock’s personal work
- Christoph Eviau’s Big List of (1900+) D3 Examples
Here are some general D3 tutorials you may find helpful:
(Please note that these tutorials discuss D3 in general. For instructions on how to deploy D3 visualizations in WordPress, please see the next section.)
- Mike Bostock’s excellent starter, Let’s Make a Bar Chart
- Christoph Eviau’s D3 Tutorial
- Scott Murray’s D3 Tutorials
Note that if you want to develop and test D3 projects locally, you’ll have to run your own local webserver from within your laptop. There are many ways to do this, but the most lightweight is to open a terminal, cd into your development directory, and then:
python -m SimpleHTTPServer 8008 &
D3 in WordPress
Our course website incorporates D3 using the WordPress plugin, Wp-D3 by Ruben Afonso. Here is a helpful tutorial for using D3 in WordPress using this plugin.
Ruben also offers the following instructions:
- Edit your post in Text mode! (This will avoid accidental replacement of ‘<‘ and ‘>’)
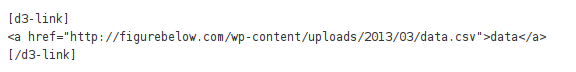
- If you have any extra dependency, add the tags [d3-link] [/d3-link], if not jump directly to step 4.
- If your code depends on .js, .css, .json third-party files: Click between the [d3-link] tags to place the mouse cursor. Add the dependency files to the post through ‘Add Media’ button, select them, and then click on ‘Insert into page’. The returned links should be now between the [d3-link] and [/d3-link] tags.
- Paste your d3 code between [d3-source’] and [/d3-source] tags. You can specify the canvas name, where the code is placed, adding the ‘canvas’ parameter e.g. [d3-source canvas=”xxx”], where xxx is the canvas name. The default id is “canvas”.
- Save your post.
I followed the tutorial linked above, which produces the pie chart shown here:
In the interest of 404-paranoia, I’ve reposted Afonso’s tutorial for this demonstration, below. Note that in my local copy, I have replaced the data file with this locally-stored copy as well:
http://golancourses.net/2014/wp-content/uploads/2013/12/wpd3-demo-data.csv
This is a short tutorial to show how to use wp-d3 wordpress plugin and add successfully a D3 snippet into your posts. We are going to add a simple pie chart as an example, extracted from bl.ocks.org, and seen above these lines.
The first step is to edit the post and add the d3-link tags.
This tag contains a list with any needed auxiliary data file (i.e. javascript or css) needed.
The link is the text returned when selecting Add Media -> (select the file) -> Insert into Post.
For example in this post, the pie values are read from a csv:
Then the code is pasted between d3-source tags. The div where inserting the snippet can be specified by means of the canvas attribute (by default it will look for “canvas” if not provided):
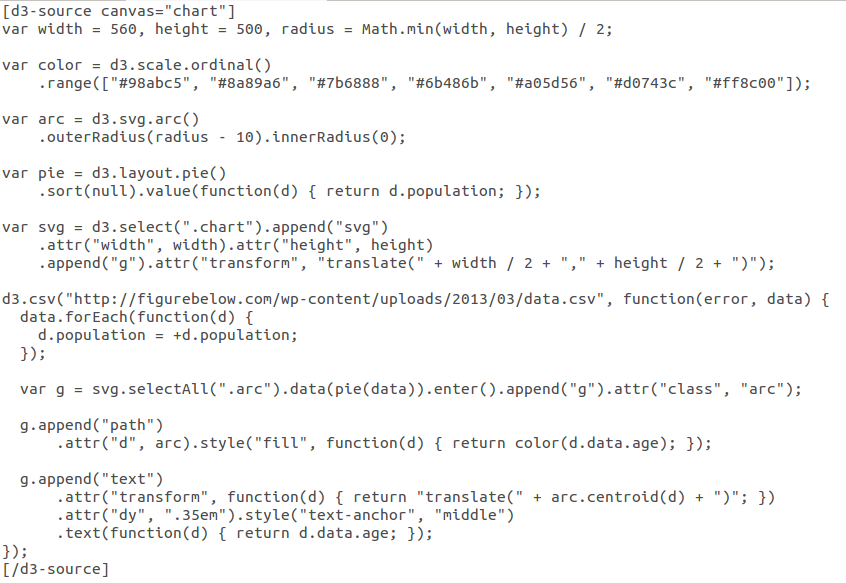
(You can also obtain this code if you view-source on this page, not including the D3 escape tags.) Notice that the csv file path has been replaced with the path in the wordpress installation, and the div where attach the canvas (called “chart” in this case) has the same name as the canvas attribute of the tag. And that’s it.
Here’s another example of D3 in WordPress by Afonso, of a timeline.
Piping Google Spreadsheets to D3 with Sheetsee
Jessica Lord’s Sheetsee is a handy tool for piping data from a live Google spreadsheet to a D3 visualization. She writes: “The goal for Sheetsee.js is to use Google spreadsheets as an easy way to store, serve and collaborate on data all the while feeding it into a website that visualizes the data. Once the website and spreadsheet are connected, you only need to interact with the spreadsheet; add another row and with every autosave your website reflects the changes. No pushing or uploading, no teaching collaborators anything more than the spreadsheet.” Jessica points out that the Google Spreadsheet can be automatically updated by means of (e.g.) IFTTT.

I’ve placed a complete information page about using Sheetsee here:
http://golancourses.net/2014/resources-and-tools/tools-and-libraries/sheetsee/