Here’s a working test of Sheetsee by Jessica Lord, a utility which allows a Google spreadsheet to be used as the data source for a D3 visualization. You can find complete information about Sheetsee here: https://github.com/jlord/sheetsee.js/ and here: http://jlord.us/sheetsee-3/.
Jessica has made some simple tutorials here:
Likewise, she has some nice demos:
- http://jlord.github.io/sheetsee.js/demos/demo-map.html
- http://jlord.github.io/sheetsee.js/demos/demo-table.html
Ok, down to business. Suppose I have a Google spreadsheet — in this case, I have some Lat/Long data for a bunch of locations associated with ID numbers:
Time to visualize this as a map. Annoyingly, it’s a trick to get Sheetsee working properly in WordPress, owing to the challenges of including Javascript within WordPress posts and pages. However, with a bit of tinkering (described below), it’s clearly possible:
Here’s the HTML I used in this WordPress page to achieve this. I’ve included this as an image to avoid character formatting problems (view-source to get text):
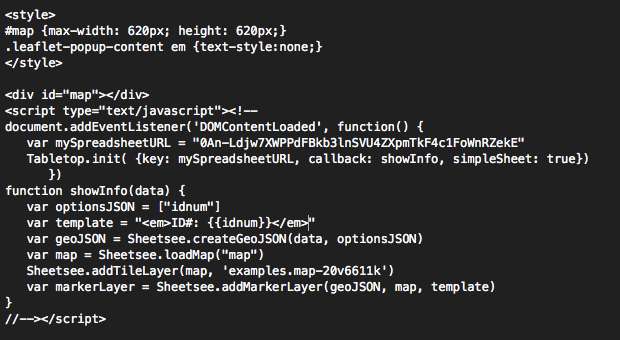
Note: To make this work properly in WordPress, I had to use employ the “Text Control” plugin with this post, selecting the settings “No Formatting” and “No Character Encoding”. This makes sure that the javascript code is executed instead of displayed. Needless to say, you won’t be able to use the rich text editor. YMMMV.
Incidentally, an alternative approach would be to host the visualization elsewhere and include it through an iFrame. I’ve done that below, with the same visualization hosted at http://flong.com/temp/misc/sheetsee/golan.html. You’ll note that the behavior and appearance are worse in the locally-stored version (above); this seems to be the result of conflicts with the WordPress CSS. (In the iFrame version below, it’s possible to see the nice Leaflet hover-overs.)
So why not just use the iFrame version? Well, it requires you to have a host somewhere else, and keep it maintained.